

Question: The following table represents the activities data and interrelations for a small engineering project. A. Draw the corresponding Activity-On-Node network diagram (Use the given shape
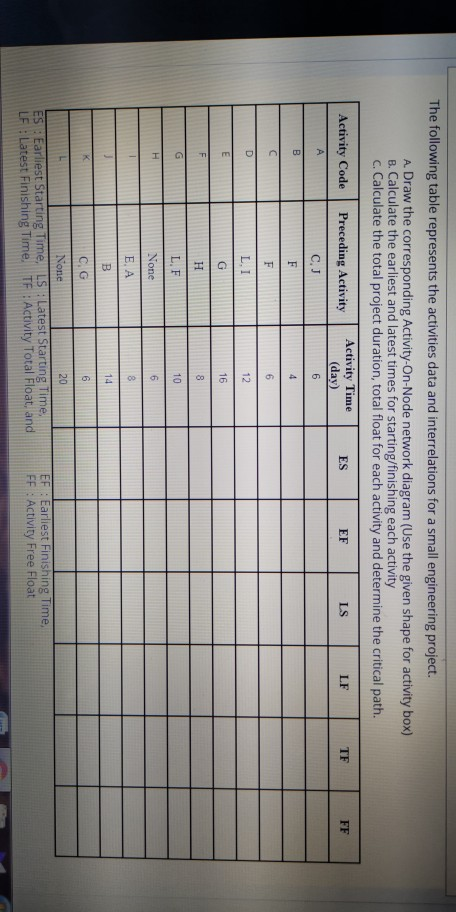
The following table represents the activities data and interrelations for a small engineering project. A. Draw the corresponding Activity-On-Node network diagram (Use the given shape for activity box) B. Calculate the earliest and latest times for starting/finishing each activity c. Calculate the total project duration, total float for each activity and determine the critical path. Activity Code Preceding Activity Activity Time ES EF LS LF (day) C.J TF FF A 6 B F 4 C F 6 D LI 12 E G 16 F 8 G L.F 10 H None 6 , 8 B 14 K L c, G 6 None 20 ES: Earliest Starting Time, LS: Latest Starting Time, LF : Latest Finishing Time TF : Activity Total Float, and EF: Earliest Finishing Time, FF : Activity Free Float
Step by Step Solution
There are 3 Steps involved in it
1 Expert Approved Answer
Step: 1 Unlock

Question Has Been Solved by an Expert!
Get step-by-step solutions from verified subject matter experts
Step: 2 Unlock
Step: 3 Unlock