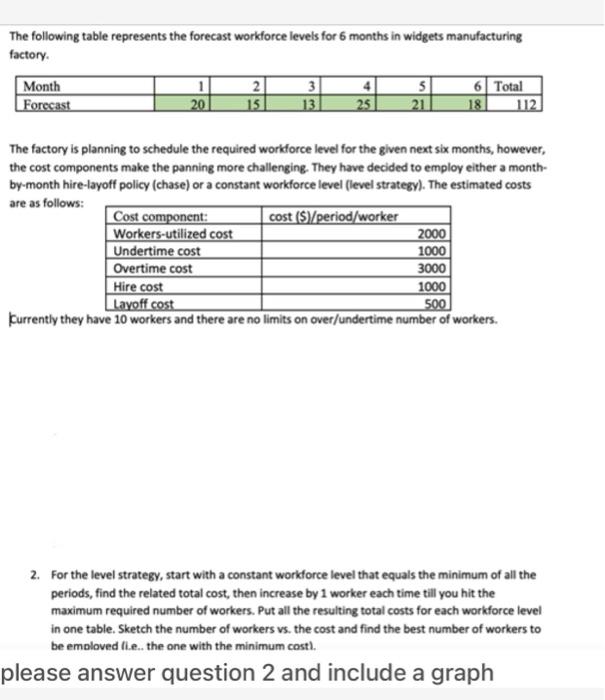
Question: The following table represents the forecast workforce levels for 6 months in widgets manufacturing factory Month Forecast 20 2 15 3 13 4 25 5

The following table represents the forecast
The following table represents the forecast workforce levels for 6 months in widgets manufacturing factory Month Forecast 20 2 15 3 13 4 25 5 21 6 Total 18 112 The factory is planning to schedule the required workforce level for the given next six months, however, the cost components make the panning more challenging. They have decided to employ either a month- by-month hire-layoff policy (chase) or a constant workforce level (level strategy). The estimated costs are as follows: Cost component: cost (S)/period/worker Workers-utilized cost 2000 Undertime cost 1000 Overtime cost 3000 Hire cost 1000 Layoff cost 500 Kurrently they have 10 workers and there are no limits on over/undertime number of workers. 2. For the level strategy, start with a constant workforce level that equals the minimum of all the periods, find the related total cost, then increase by 1 worker each time till you hit the maximum required number of workers. Put all the resulting total costs for each workforce level in one table, Sketch the number of workers vs. the cost and find the best number of workers to be emoloved i.e.. the one with the minimum cost), please answer question 2 and include a graph

Step by Step Solution

There are 3 Steps involved in it

1 Expert Approved Answer
Step: 1 Unlock blur-text-image
Question Has Been Solved by an Expert!

Get step-by-step solutions from verified subject matter experts

Step: 2 Unlock
Step: 3 Unlock

Students Have Also Explored These Related General Management Questions!