

The following table represents the overall change for calendar years 2018, 2019 and 2020 1. Show the
Fantastic news! We've Found the answer you've been seeking!
Question:
The following table represents the overall change for calendar years 2018, 2019 and 2020
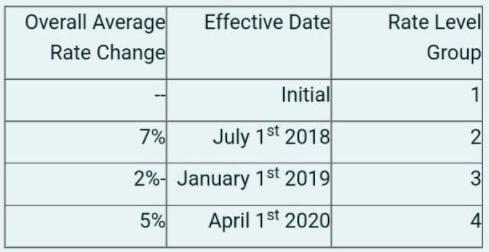
1. Show the graph of the policies according to Calendar year method
2. Calculate areas effective in Calendar year 2019
3. Calculate the cumulative rate level index for each year
4. Calculate the average rate level index for 2019 which is the weighted average of the cumulative rate level indices calculated in part 3
5. Calculate the on-level factor for historical period.
Expert Answer:

Related Book For 

Posted Date:
