

Question: The following table represents the relationship between the delinquency index (DI) and intelligence quotient (IQ) of a sample of 18 convicted minors. A sociologist assigned
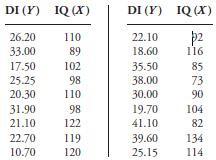
The following table represents the relationship between the delinquency index (DI) and intelligence quotient (IQ) of a sample of 18 convicted minors.
A sociologist assigned to a correctional institution was interested in studying the relationship between intelligence and delinquency. A delinquency index (ranging from 0 to 50) was formulated to account for both the severity and the frequency of crimes committed, while intelligence was measured by IQ. The following table displays the delinquency index (DI) and IQ of a sample of 18 convicted minors.
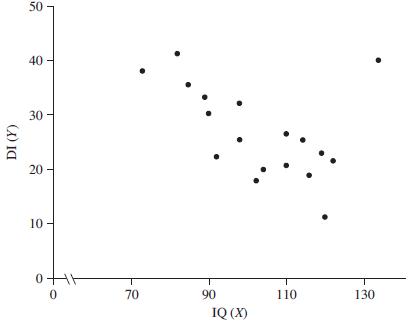
a. Given that ![]() = −0.249 and
= −0.249 and ![]() = 52.273, draw the estimated regression line on the accompanying scatter diagram.
= 52.273, draw the estimated regression line on the accompanying scatter diagram.
b. How do you account for the fact that ![]() = 52.273 when IQ = 0, even though the delinquency index goes no higher than 50?
= 52.273 when IQ = 0, even though the delinquency index goes no higher than 50?
c. Find a 95% confidence interval for the true slope β1 using the fact that SY|X = 7.704 and Sx = 16.192.
d. Interpret this confidence interval with regard to testing the null hypothesis of zero slope at the α = .05 level.
e. Notice that the convicted minor with IQ = 134 and DI = 39.6 appears to be quite out of place in the data. Decide whether this outlier has any effect on your estimate of the IQ−DI relationship by looking at the graph for the fitted line obtained when the outlier is omitted. (Note that ![]() = 70.846 and
= 70.846 and ![]() = −0.444 when the outlier is removed.)
= −0.444 when the outlier is removed.)
f. Test the null hypothesis of zero slope when the outlier is removed, given that SY|X = 4.933, Sx = 14.693, and n = 17. (Use α = .05.)
g. For these data, would you conclude that the delinquency index decreases as IQ increases?
DI (Y) IQ (X) 26.20 33.00 110 89 17.50 102 25.25 20.30 31.90 21.10 22.70 10.70 98 110 98 122 119 120 DI (Y) 22.10 18.60 35.50 38.00 30.00 19.70 41.10 39.60 25.15 IQ (X) p2 116 85 73 90 104 82 134 114
Step by Step Solution
3.43 Rating (153 Votes )
There are 3 Steps involved in it
a Given that 1 0249 and 0 52273 draw the estimated regression line on the accompanying scatter diagram The estimated regression line for the relationship between DI and IQ can be drawn on the accompan... View full answer

Get step-by-step solutions from verified subject matter experts