

Question: The following table shows a net present value and internal rate of return calculation for a project. Use Data Table to do a sensitivity analysis
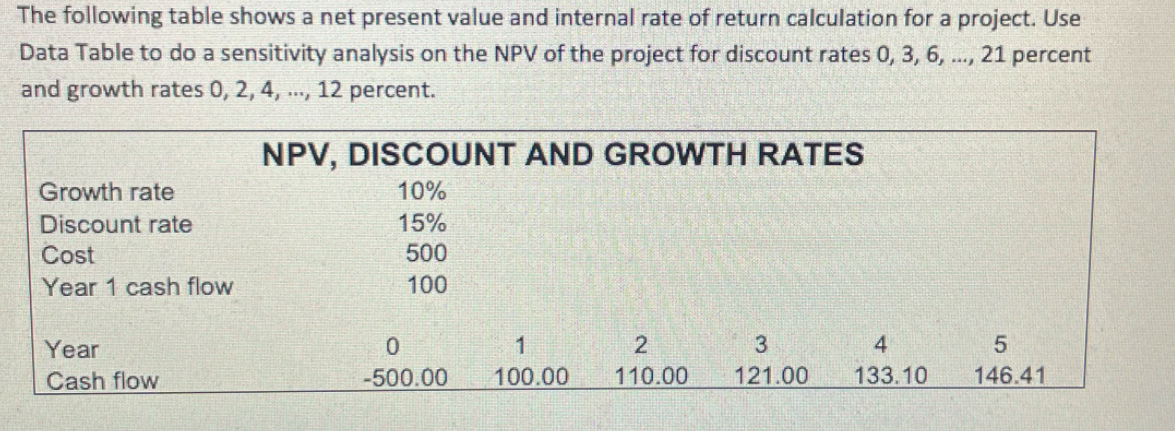
The following table shows a net present value and internal rate of return calculation for a project. Use Data Table to do a sensitivity analysis on the NPV of the project for discount rates 0,3, 6, ..., 21 percent and growth rates 0, 2, 4, ---, 12 percent. Growth rate Discount rate Cost Year 1 cash flow NPV, DISCOUNT AND GROWTH RATES 10% 15% 500 100 Year Cash flow 0 -500.00 1 100.00 2 110.00 3 121.00 4 133.10 5 146.41
Step by Step Solution
There are 3 Steps involved in it
1 Expert Approved Answer
Step: 1 Unlock

Question Has Been Solved by an Expert!
Get step-by-step solutions from verified subject matter experts
Step: 2 Unlock
Step: 3 Unlock