

Question: The spreadsheet fragment below shows a net present value and internal rate of return calculation for a project: Use Data Table to do a sensitivity
The spreadsheet fragment below shows a net present value and internal rate of return calculation for a project:
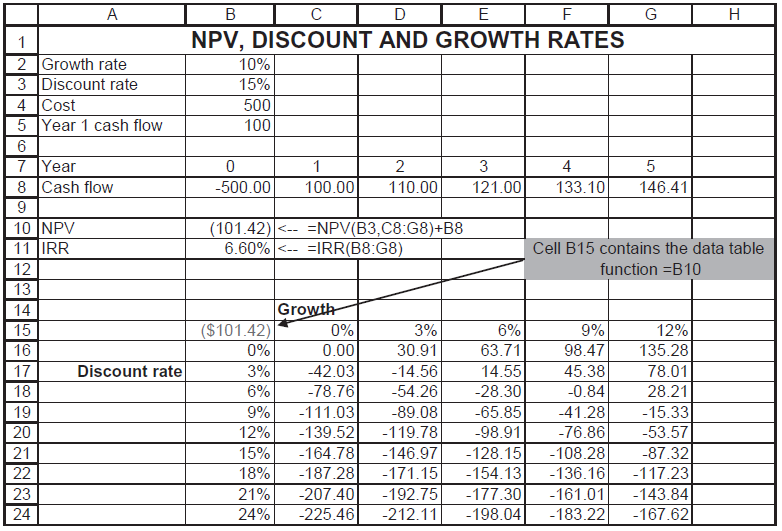
Use Data Table to do a sensitivity analysis on the NPV of the project, varying the discount rates from 0%, 3%, 6%, ?, 21% and varying the growth rates from 0%, 3%, ?, 12%.
D E NPV, DISCOUNT AND GROWTH RATES A F G H 1 2 Growth rate 3 Discount rate 4 Cost 5 Year 1 cash flow 10% 15% 500 100 6 7 Year 8 Cash flow 1 2 3 4 -500.00 100.00 110.00 121.00 133.10 146.41 10 NPV 11 IRR (101.42)
Step by Step Solution
★★★★★
3.48 Rating (174 Votes )
There are 3 Steps involved in it
1 Expert Approved Answer
Step: 1 Unlock

Question Has Been Solved by an Expert!
Get step-by-step solutions from verified subject matter experts
Step: 2 Unlock
Step: 3 Unlock