

Question: The following table shows activities with duration, dependency, dependency type, and the number of workers from one small segment of a project network. Draw the
The following table shows activities with duration, dependency, dependency type, and the number of workers from one small segment of a project network. Draw the segment of the network diagram and then: (a) Show the resource usage (chart) if activities A, B, and C start on day one; (b) Show the new network diagram and the resource usage (chart) when resources are leveled after applying appropriate slack times.
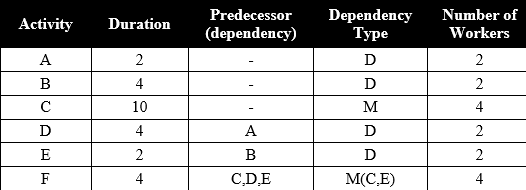
Activity DurationPredcessor Number of Workers Duration(dependency) Type 10 C,D,E M(C,E)
Step by Step Solution
There are 3 Steps involved in it
1 Expert Approved Answer
Step: 1 Unlock

Question Has Been Solved by an Expert!
Get step-by-step solutions from verified subject matter experts
Step: 2 Unlock
Step: 3 Unlock