

Question: The following table shows data obtained from a single-stage traixial compression test on a cylindrical rock sample, conducted with closed loop servo- control, at
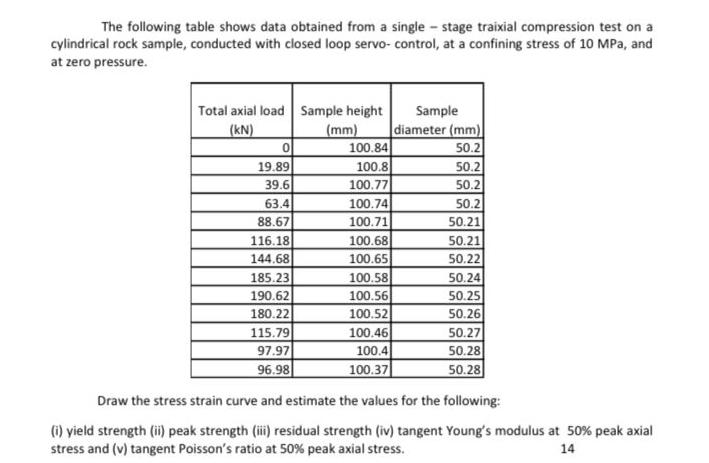
The following table shows data obtained from a single-stage traixial compression test on a cylindrical rock sample, conducted with closed loop servo- control, at a confining stress of 10 MPa, and at zero pressure. Total axial load Sample height (KN) (mm) 0 19.89 39.6 63.4 88.67 116.18 144.68 185.23 190.62 180.22 115.79 97.97 96.98 100.84 100.8 100.77 100.74 100.71 100.68 100.65 100.58 100.56 100.52 100.46 100.4 100.37 Sample diameter (mm) 50.2 50.2 50.2 50.2 50.21 50.21 50.22 50.24 50.25 50.26 50.27 50.28 50.28 Draw the stress strain curve and estimate the values for the following: (i) yield strength (ii) peak strength (iii) residual strength (iv) tangent Young's modulus at 50% peak axial stress and (v) tangent Poisson's ratio at 50% peak axial stress. 14
Step by Step Solution
3.49 Rating (156 Votes )
There are 3 Steps involved in it

Get step-by-step solutions from verified subject matter experts