

Question: The following table shows predicted product demand using your particular forecasting method along with the actual demand that occurred: table [ [ FORECAST ,
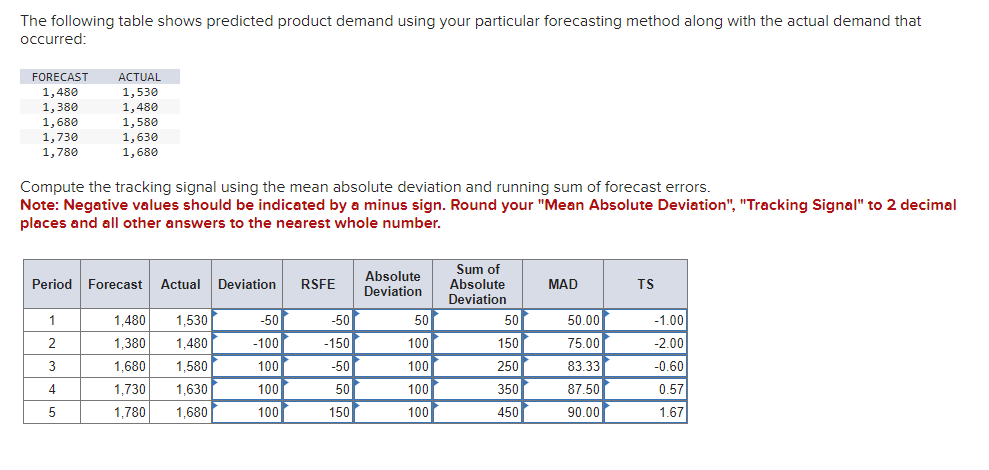
The following table shows predicted product demand using your particular forecasting method along with the actual demand that occurred:
tableFORECASTACTUAL
Compute the tracking signal using the mean absolute deviation and running sum of forecast errors.
Note: Negative values should be indicated by a minus sign. Round your "Mean Absolute Deviation", "Tracking Signal" to decimal places and all other answers to the nearest whole number.
tablePeriodForecast,Actual,Deviation,RSFE,tableAbsoluteDeviationtableSum ofAbsoluteDeviationMAD,TSDeviation RSFE and TS are wrong
Step by Step Solution
There are 3 Steps involved in it
1 Expert Approved Answer
Step: 1 Unlock

Question Has Been Solved by an Expert!
Get step-by-step solutions from verified subject matter experts
Step: 2 Unlock
Step: 3 Unlock