

Question: The following table shows the actual values and forecast values calculated using a linear trend with seasonality model for a time series of quarterlyprice index:
The following table shows the actual values and forecast values calculated using a linear trend with seasonality model for a time series of quarterlyprice index:
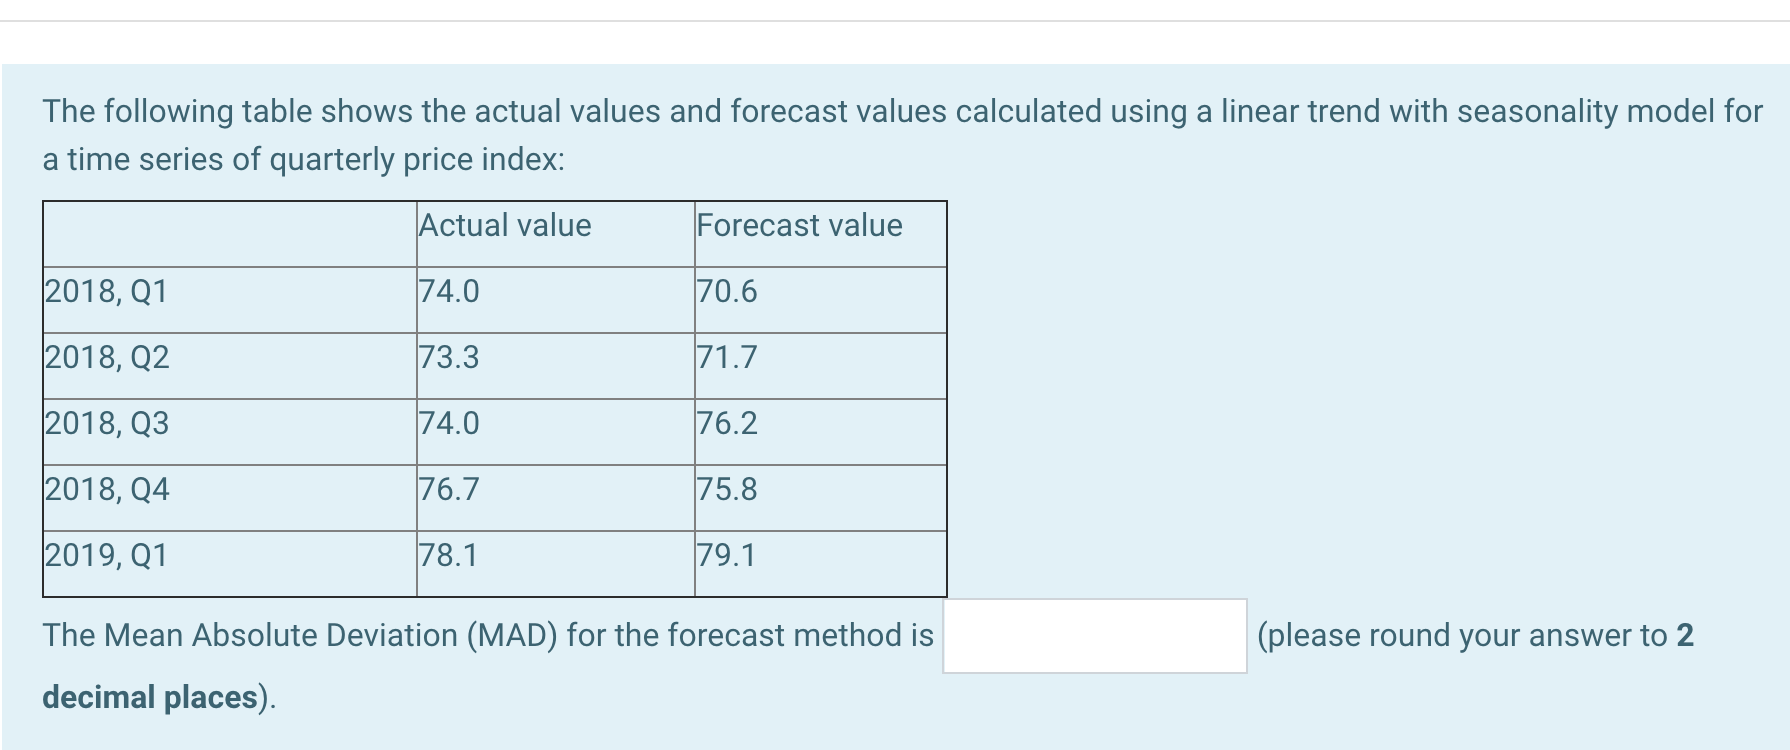
The following table shows the actual values and forecast values calculated using a linear trend with seasonality model for a time series of quarterly price index: ' ctual value Forecast value 2018, 01 70.6 2018, 02 71.7 2018, 03 76.2 2018, Q4 75.8 2019, 01 79.1 The Mean Absolute Deviation (MAD) for the forecast method is (please round your answer to 2 decimal places)
Step by Step Solution
There are 3 Steps involved in it
1 Expert Approved Answer
Step: 1 Unlock

Question Has Been Solved by an Expert!
Get step-by-step solutions from verified subject matter experts
Step: 2 Unlock
Step: 3 Unlock