Question: 39 Activity F has one predecessor activity: Activity E. The EF (early finish) of Activity E is 18. Therefore, the ES (early start) of Activity
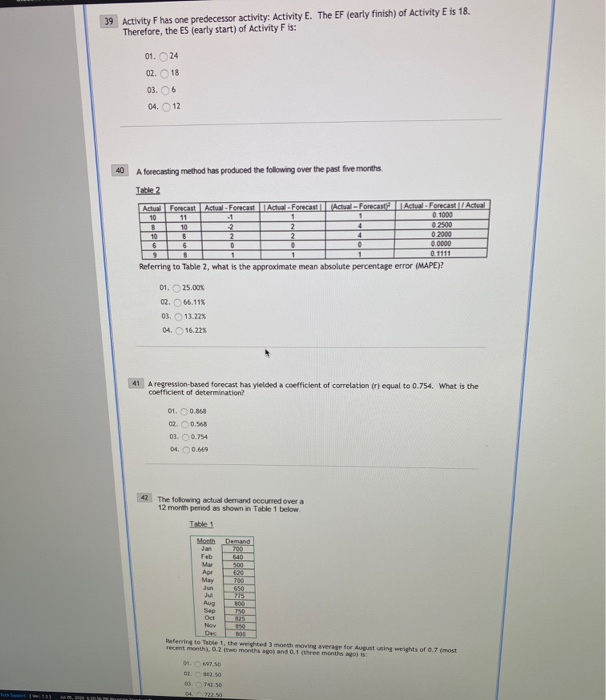
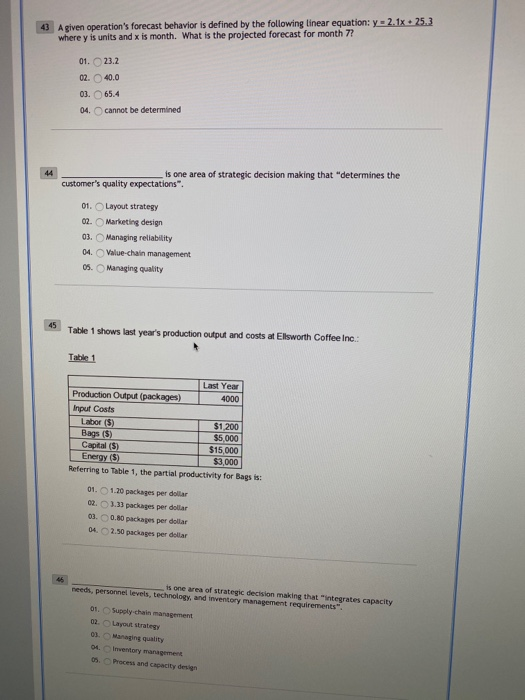
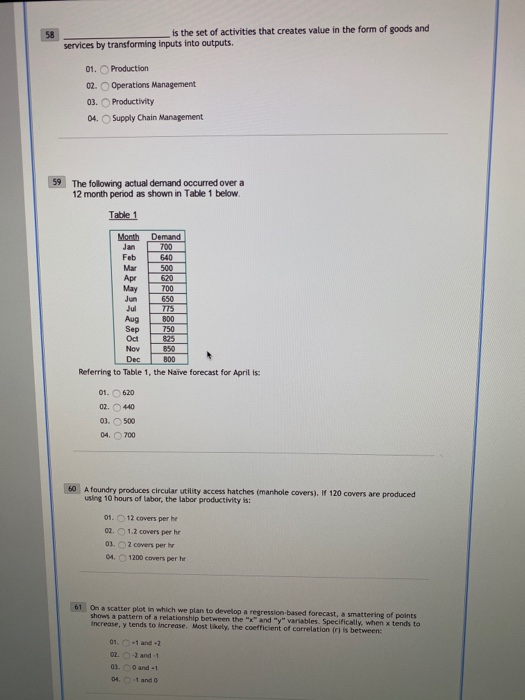
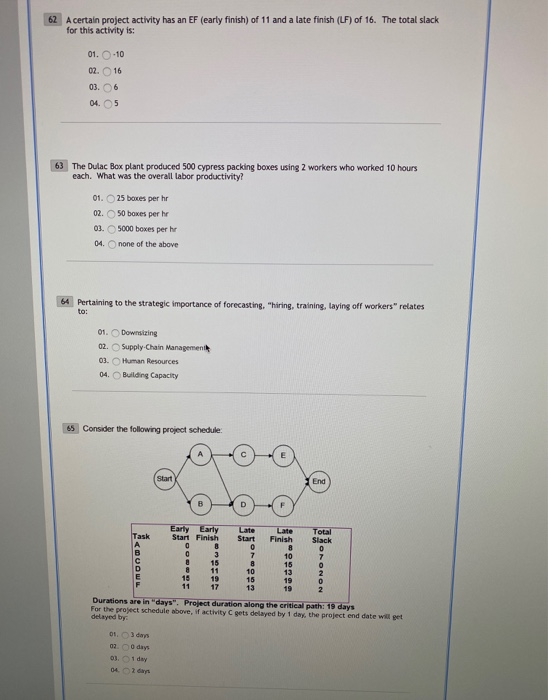
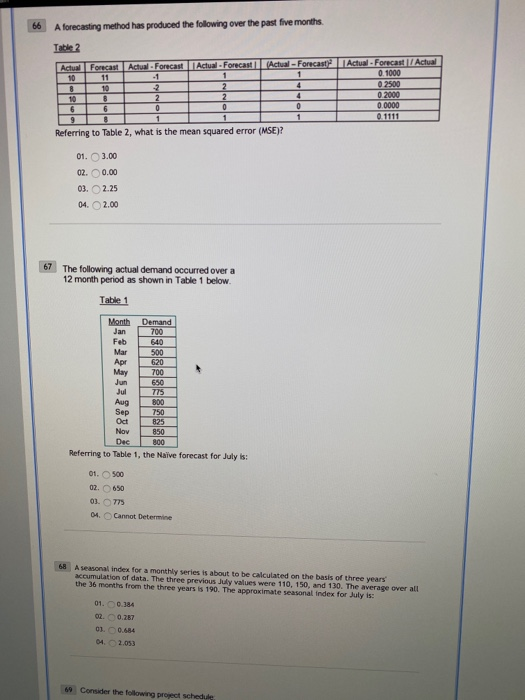
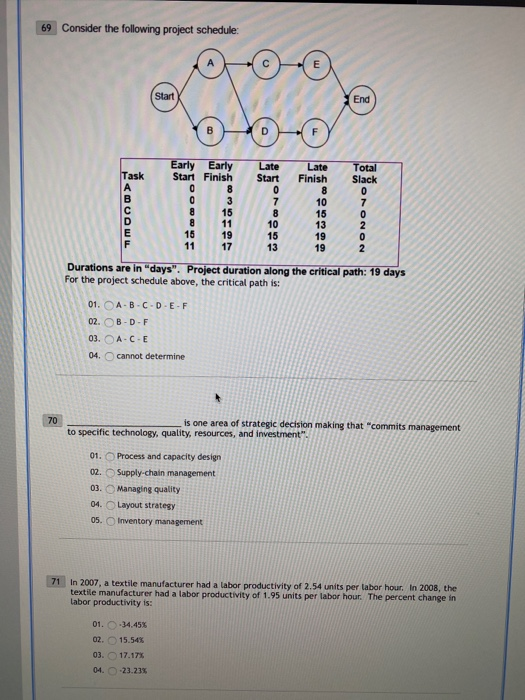
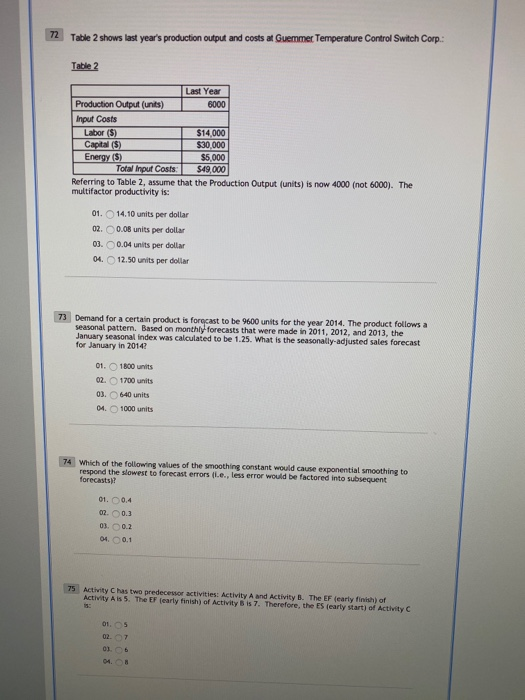
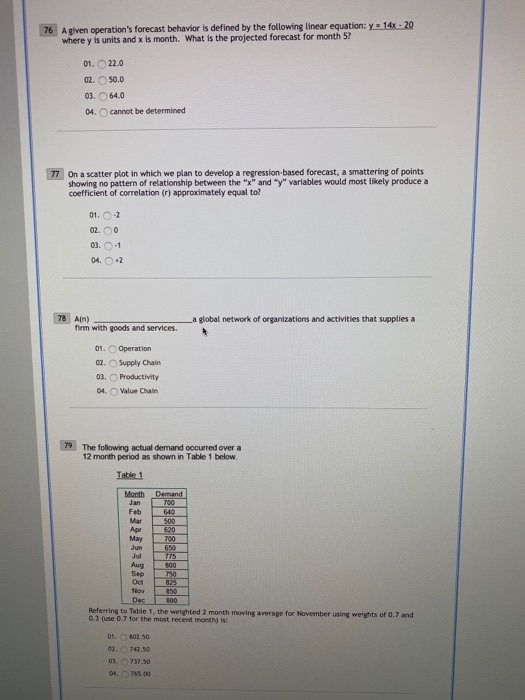
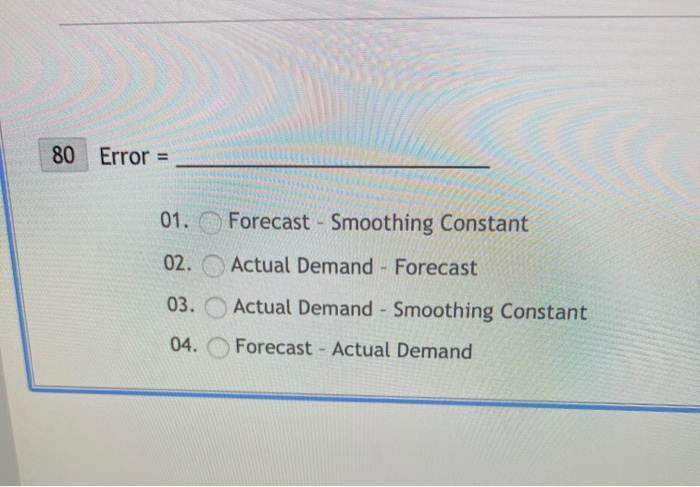
39 Activity F has one predecessor activity: Activity E. The EF (early finish) of Activity E is 18. Therefore, the ES (early start) of Activity Fis: 01.24 02.18 03.6 04.12 40 A forecasting method has produced the following over the past five months Tatie Actual Forecast Actual. Forecast Actual. Forecast (Actual - Forecast Actual. Forecast Actual 10 11 1 1000 8 10 2 4 0 2500 10 2 2 4 0 2000 6 6 0 0 0.0000 9 1 1 1 0.1111 Referring to Table 2, what is the approximate mean absolute percentage error (MAPE)? 01.25.00% 02.66.11% 03. 13.22% 04.16.22% 41 A regression-based forecast has yielded a coefficient of correlation (r) equal to 0.754. What is the coefficient of determination? 01.0.160 02. 0.568 03. 0.754 04. 0.669 The following actual demand occurred over a 12 month period as shown in Table 1 below Table 1 Month Demand 700 FD Mer Apr May Jun 620 700 650 Aug Sep Oct 800 750 325 500 Referring to Table the weighted monthning average for Augusting weights of 0.7 most recent month. 02 months and 0.1 hree months 011 697.50 22 43 A given operation's forecast behavior is defined by the following linear equation: y = 2.1x. 25.3 where y is units and x is month. What is the projected forecast for month 7? 01. 23.2 02.40.0 03.65.4 04. cannot be determined 44 is one area of strategic decision making that "determines the customer's quality expectations". 01. Layout strategy 02. Marketing design 03. Managing reliability 04. Value-chain management 05. Managing quality 45 Table 1 shows last year's production output and costs at Ellsworth Coffee Inc.: Table 1 Last Year Production Output (packages) 4000 Input Costs Labor ($) $1.200 Bags (5) $5,000 Capital ($) $15,000 Energy ($) $3,000 Referring to Table 1, the partial productivity for Bags is: 01. 1.20 packages per dollar 02.3.33 packages per dollar 01. 0.80 packages per dollar 04. 2.50 packages per dollar is one area of strategic decision making that integrates capacity needs, personnel levels, technology, and inventory management requirements 01. Supply chain management 02 Layout strategy 01. Inventory management 05. Process and capacity design 47 A given project's expected duration along its critical path is 32 days. The project's standard deviation along its critical path is 4 days. What is the probability that the project will finish on or before 35 days. 01. 0.27337 02. 0.77935 03. 0.78230 04. 0.77337 48 A certain project has ten activities. Two activities each have a total slack of 5 days. The total duration of the project's critical path is 40 days. The duration of the project is 01. 40 days 02.35 days 03. 30 days 04. 5 days 49 is one area of strategic decision making that considers inventory ordering and holding decisions and how to optimize them as customer satisfaction, supplier capability, and production schedules are considered". 01. Operations management 02. Quality management 03. Shop floor management 04. Value-chain management 05. Inventory management 50 Acertain project activity has an EF (early finish) of 11 and a late finish (LF) of 11. The total stack for this activity is: 01. -12 02-0 04. 24 51 Pertaining to the strategic importance of forecasting, shortages in what area can result in loss of customers, and loss of market share: 01. 02.Personnel 01 Supply Chain 04. Capacity 52 An activity on a project schedule has these duration estimates: optimistic (a) = 1, most likely (m) -2, and pessimistic (b) - 5. The activity's variance is: 01. 0.2213 02. 0.3333 03. 0.4444 04. 0.6667 53 Forecast A has a MAD (Mean Absolute Deviation) of 12.7. Forecast B has a MSE (Mean Squared Error) of 7.8. Which forecast is the most accurate? 01. Forecast B 02. Both are equally accurate 03. Forecast A 04. Cannot determine 54 A certain project activity has a total slack of 0 days. If this activity gets delayed by 3 days, the project finish date will get delayed by: 01. 3 days 02. 2 days 03. 0 days 04. 1 day 55 A given project's expected duration along its critical path is 50 days, based on optimisti, most tikely, and pessimistic duration estimates. What is the probability that the project will finish on or before 50 days 01. 1.00 02 0.00 03. 0.25 04.0.50 56 Given a previous demand of 61, a previous forecast of 5, and a smoothing constant of 0.3, the exponential smoothing forecast for the current period would be 01.589 0445.5 is the ratio of outputs divided by one or more input 01 Production 04 active 58 is the set of activities that creates value in the form of goods and services by transforming inputs into outputs. 01. Production 02. Operations Management 03. Productivity 04. Supply Chain Management 59 The following actual demand occurred over a 12 month period as shown in Table 1 below. Table 1 Apr Month Demand Jan 700 Feb 640 Mar 500 620 May 700 Jun 650 Jul 775 Aug 800 Sep 750 Oct 825 Nov 850 Dec 800 Referring to Table 1, the Naive forecast for April is: LLLLLLLL 01.620 02. 440 03. 500 04.700 60 A foundry produces circular utility access hatches (manhole covers). If 120 covers are produced using 10 hours of labor, the labor productivity is: 01. 12 covers per he 02.1.2 covers per he 03. 2 covers perhe 04. 1200 covers per hr 61 On a scatter plot in which we plan to develop a regression based forecast, a smattering of points shows a pattern of a relationship between the "x" and "y" variables. Specifically, when x tends to Increase, y tends to increase. Most likely, the coefficient of correlation (r) is between 01. 1 and 2 02.2 and 1 01 O and 1 04.1 and 62 A certain project activity has an EF (early finish) of 11 and a late finish (LF) of 16. The total slack for this activity is: 01..10 02.16 03.06 04.05 63 The Dulac Box plant produced 500 cypress packing boxes using 2 workers who worked 10 hours each. What was the overall labor productivity? 01. 25 boxes per hr 02.50 boxes per le 03. 5000 boxes per hr 04. none of the above 64 Pertaining to the strategic importance of forecasting, "hiring, training, laying off workers" relates to: 01. Downsizing 02. Supply Chain Management 03. Human Resources 04. Building Capacity . Consider the following project schedule: Start End D Task Late Finish Early Early Start Finish 0 0 3 15 11 19 11 17 Late Start 0 7 8 10 15 13 Total Slack 0 7 0 10 16 13 19 19 2 Durations are in "days". Project duration along the critical path: 19 days For the project schedule above, if activity C gets delayed by 1 day, the project end date will get delayed by 03 days 01. 1 day 042 days 66 A forecasting method has produced the following over the past five months Table 2 4 Actual Forecast Actual - Forecast Actual - Forecast (Actual - Forecast 10 11 1 8 2 10 8 2 2 6 6 0 0 0 9 8 1 1 1 Referring to Table 2, what is the mean squared error (MSE)? Actual - Forecast Actual 0.1000 0 2500 0.2000 0.0000 01. 3.00 02. 0.00 03. 2.25 04. 2.00 67 The following actual demand occurred over a 12 month period as shown in Table 1 below. Table 1 Month Demand Jan 700 Feb 640 Mar 500 Apr 620 May 700 Jun 650 Jul 775 Aug 800 Sep 750 Oct 825 Nov 850 Dec 800 Referring to Table 1, the Nalive forecast for July is: FILLILIT 01.500 02.650 0.775 04. Cannot Determine 68 A seasonal index for a monthly series is about to be calculated on the basis of three years accumulation of data. The three previous July values were 110, 150, and 130. The average over all the 36 months from the three years is 190. The approximate seasonal Index for July is: 01. 0.384 02. 0.287 01 0.684 04. 2.053 * Consider the following project schedule 69 Consider the following project schedule: Start End Task Early Early Start Finish 8 0 3 8 15 8 11 15 19 11 17 Late Start 0 7 8 10 15 13 Late Finish 8 10 15 13 19 19 Total Slack 0 7 0 2 0 2 Durations are in "days". Project duration along the critical path: 19 days For the project schedule above, the critical path is: 01. A-B-C-D-E-F 02. B-D-F 03. A-C-E 04. cannot determine 70 is one area of strategic decision making that "commits management to specific technology, quality, resources, and investment" 01. Process and capacity design 02. Supply-chain management 03. Managing quality 04. Layout strategy 05. Inventory management 71 In 2007, a textile manufacturer had a labor productivity of 2.54 units per labor hour. In 2008, the textile manufacturer had a labor productivity of 1.95 units per labor hour. The percent change in labor productivity is: 01. -34,45% 02. 15.54% 03.17.17% 04.-23.23% 72 Table 2 shows last year's production output and costs at Guemmer Temperature Control Switch Corp.: Table 2 Last Year Production Output (units) 6000 Input Costs Labor ($) $14,000 Capital ($) $30,000 Energy (5) $5,000 Total Input Costs $49,000 Referring to Table 2, assume that the Production Output (units) is now 4000 (not 6000). The multifactor productivity is: 01. 14.10 units per dollar 02. 0.08 units per dollar 03. 0.04 units per dollar 04.12.50 units per dollar 73 Demand for a certain product is forecast to be 9600 units for the year 2014. The product follows a seasonal pattern. Based on monthly forecasts that were made in 2011, 2012, and 2013, the January seasonal index was calculated to be 1.25. What is the seasonally-adjusted sales forecast for January in 2014? 01. 1800 units 02. 1700 units 03.640 units 01. 1000 units 74 Which of the following values of the smoothing constant would cause exponential smoothing to respond the slowest to forecast errors (ie., Less error would be factored into subsequent forecasts? 01. 0.4 02. 0.3 03.02 04.0.1 75 Activity Chas two predecessor activities: Activity A and Activity B. The EF (early finish) of Activity Ais 5. The CF (early finish) of Activity is 7. Therefore, the early start of Activity C 015 027 01 6 01.8 76 A given operation's forecast behavior is defined by the following linear equation: y = 14x - 20 where y is units and x is month. What is the projected forecast for month 5? 01. 22.0 02. 50.0 03. 64.0 04. cannot be determined 77 On a scatter plot in which we plan to develop a regression-based forecast, a smattering of points showing no pattern of relationship between the "x" and "y" variables would most likely produce a coefficient of correlation (r) approximately equal to! 01. 2 02.0 03.-1 04. 2 78 Ain) La global network of organizations and activities that supplies a firm with goods and services. 01. Operation 02. Supply Chain 03. Productivity 04. Value Chain 79 The following actual demand occurred over a 12 month period as shown in Table 1 below. Table 1 Month Demand Jan 700 Feb 640 Mar 500 Apr 620 May 700 Jun 650 Jul 775 Aug 800 Sep 750 Od 825 Nov Dec 800 Referring to Table 1, the weighted 2 month moving average for November using weights of 0.7 and 0.3 use 0.7 for the most recent month) is: 01.802.50 02-742.50 01 737.50 01765.00 80 Error = 01. Forecast - Smoothing Constant 02. Actual Demand - Forecast 03. Actual Demand - Smoothing Constant 04. Forecast - Actual Demand