

Question: The following table shows the annual expected returns for two stocks. Probability of return Stock A Stock B 0.10 -3% -10% 0.20 2 0.40 7
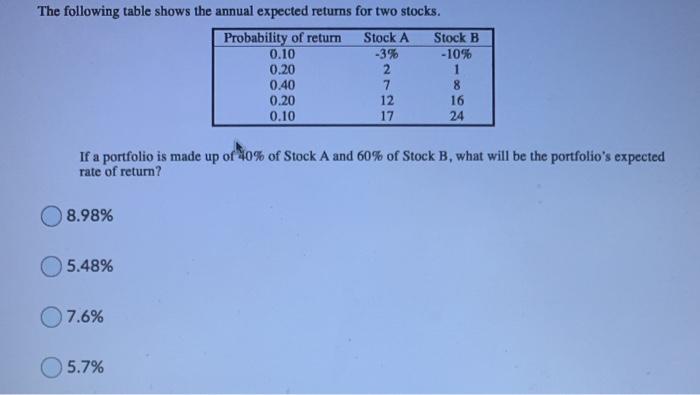
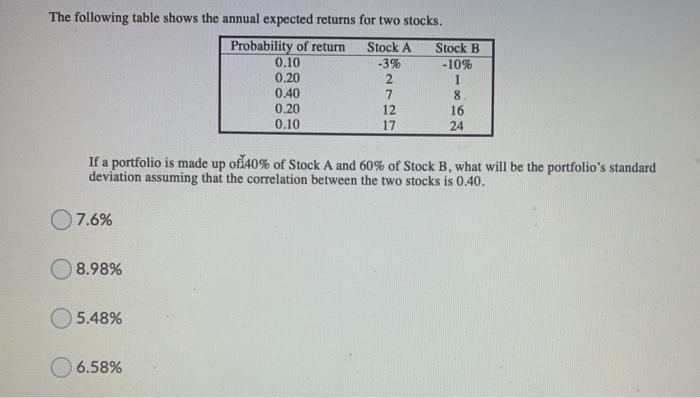
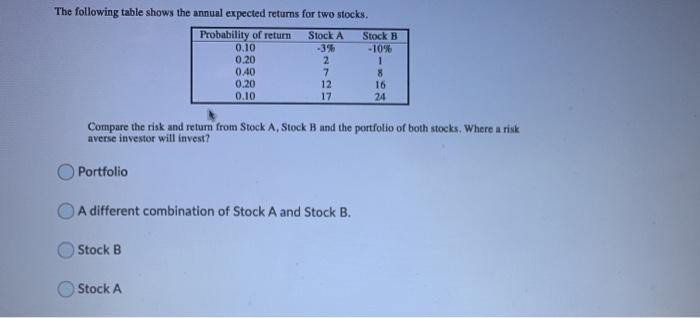
The following table shows the annual expected returns for two stocks. Probability of return Stock A Stock B 0.10 -3% -10% 0.20 2 0.40 7 0.20 12 0.10 27 17 1862 24 What is the coefficient of variation for Stock B? 1.12 0.87 1.15 0.78 The following table shows the annual expected returns for two stocks. Stock B Probability of return Stock A 0.10 -3% -10% 0.20 2 0.40 7 8 0.20 12 16 0.10 17 24 If a portfolio is made up of 40% of Stock A and 60% of Stock B, what will be the portfolio's expected rate of return? 8.98% 5.48% 7.6% 5.7% The following table shows the annual expected returns for two stocks. Probability of return Stock A Stock B 0.10 -3% -10% 0.20 2 1 0.40 7 8. 0.20 12 16 0.10 17 24 If a portfolio is made up of 40% of Stock A and 60% of Stock B, what will be the portfolio's standard deviation assuming that the correlation between the two stocks is 0.40. 7.6% 8.98% 5.48% 6.58% The following table shows the annual expected returns for two stocks. Probability of return Stock A 0.10 -3% Stock B -10% 0.20 2 1 0.40 7 8 0.20 12 16 0.10 17 24 Compare the risk and return from Stock A, Stock B and the portfolio of both stocks. Where a risk averse investor will invest? Portfolio A different combination of Stock A and Stock B. Stock B Stock A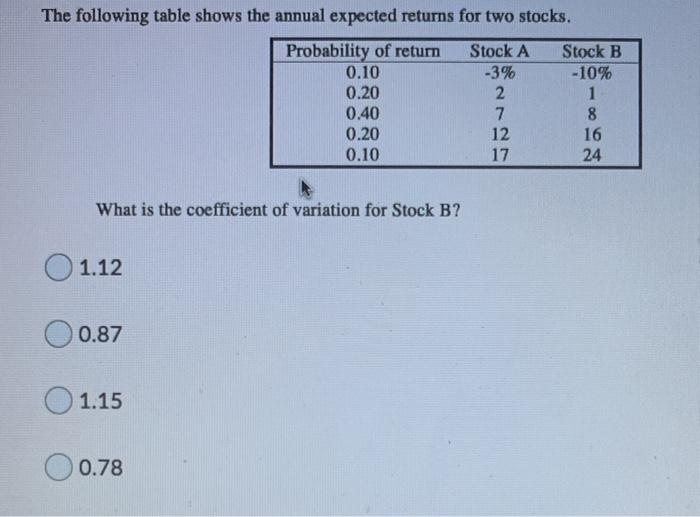
Step by Step Solution
There are 3 Steps involved in it

Get step-by-step solutions from verified subject matter experts