

Question: The following temperature / composition data from Table Q 3 . 1 were obtained for a mixture of two liquids A and B at 1
The following temperaturecomposition data from Table Q were obtained for a
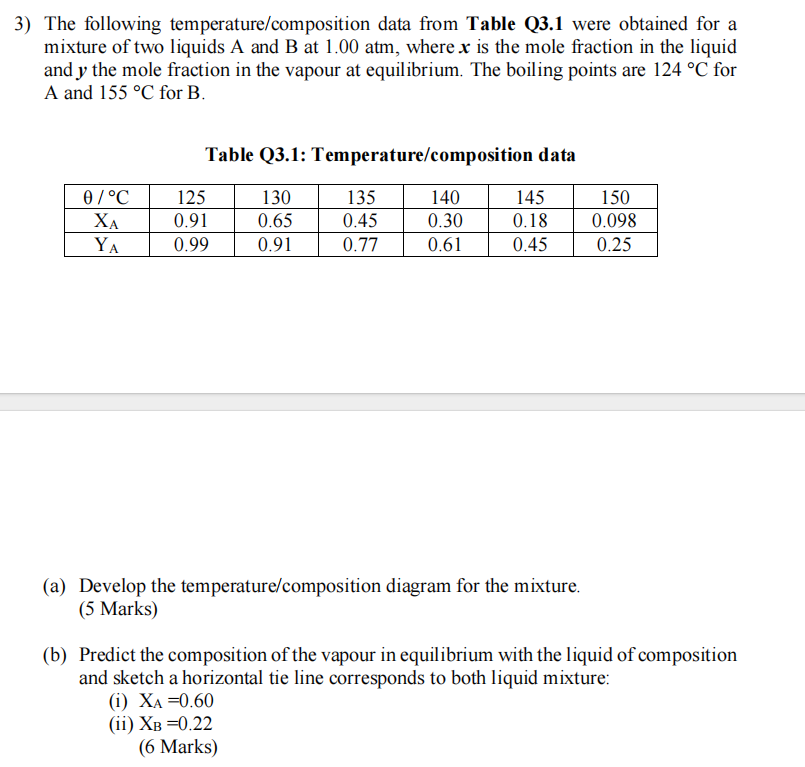
mixture of two liquids A and B at atm, where is the mole fraction in the liquid
and the mole fraction in the vapour at equilibrium. The boiling points are for
A and for
Table Q: Temperaturecomposition data
a Develop the temperaturecomposition diagram for the mixture.
Marks
b Predict the composition of the vapour in equilibrium with the liquid of composition
and sketch a horizontal tie line corresponds to both liquid mixture:
i
ii
Marks
Step by Step Solution
There are 3 Steps involved in it
1 Expert Approved Answer
Step: 1 Unlock

Question Has Been Solved by an Expert!
Get step-by-step solutions from verified subject matter experts
Step: 2 Unlock
Step: 3 Unlock