

Question: The following two graphs show the data series for nominal and real GDP in the U.S., 1960-2022: https://data.worldbank.org/indicator/NY.GDP.MKTP.CD?locations=US GDP (current US$) - United States World
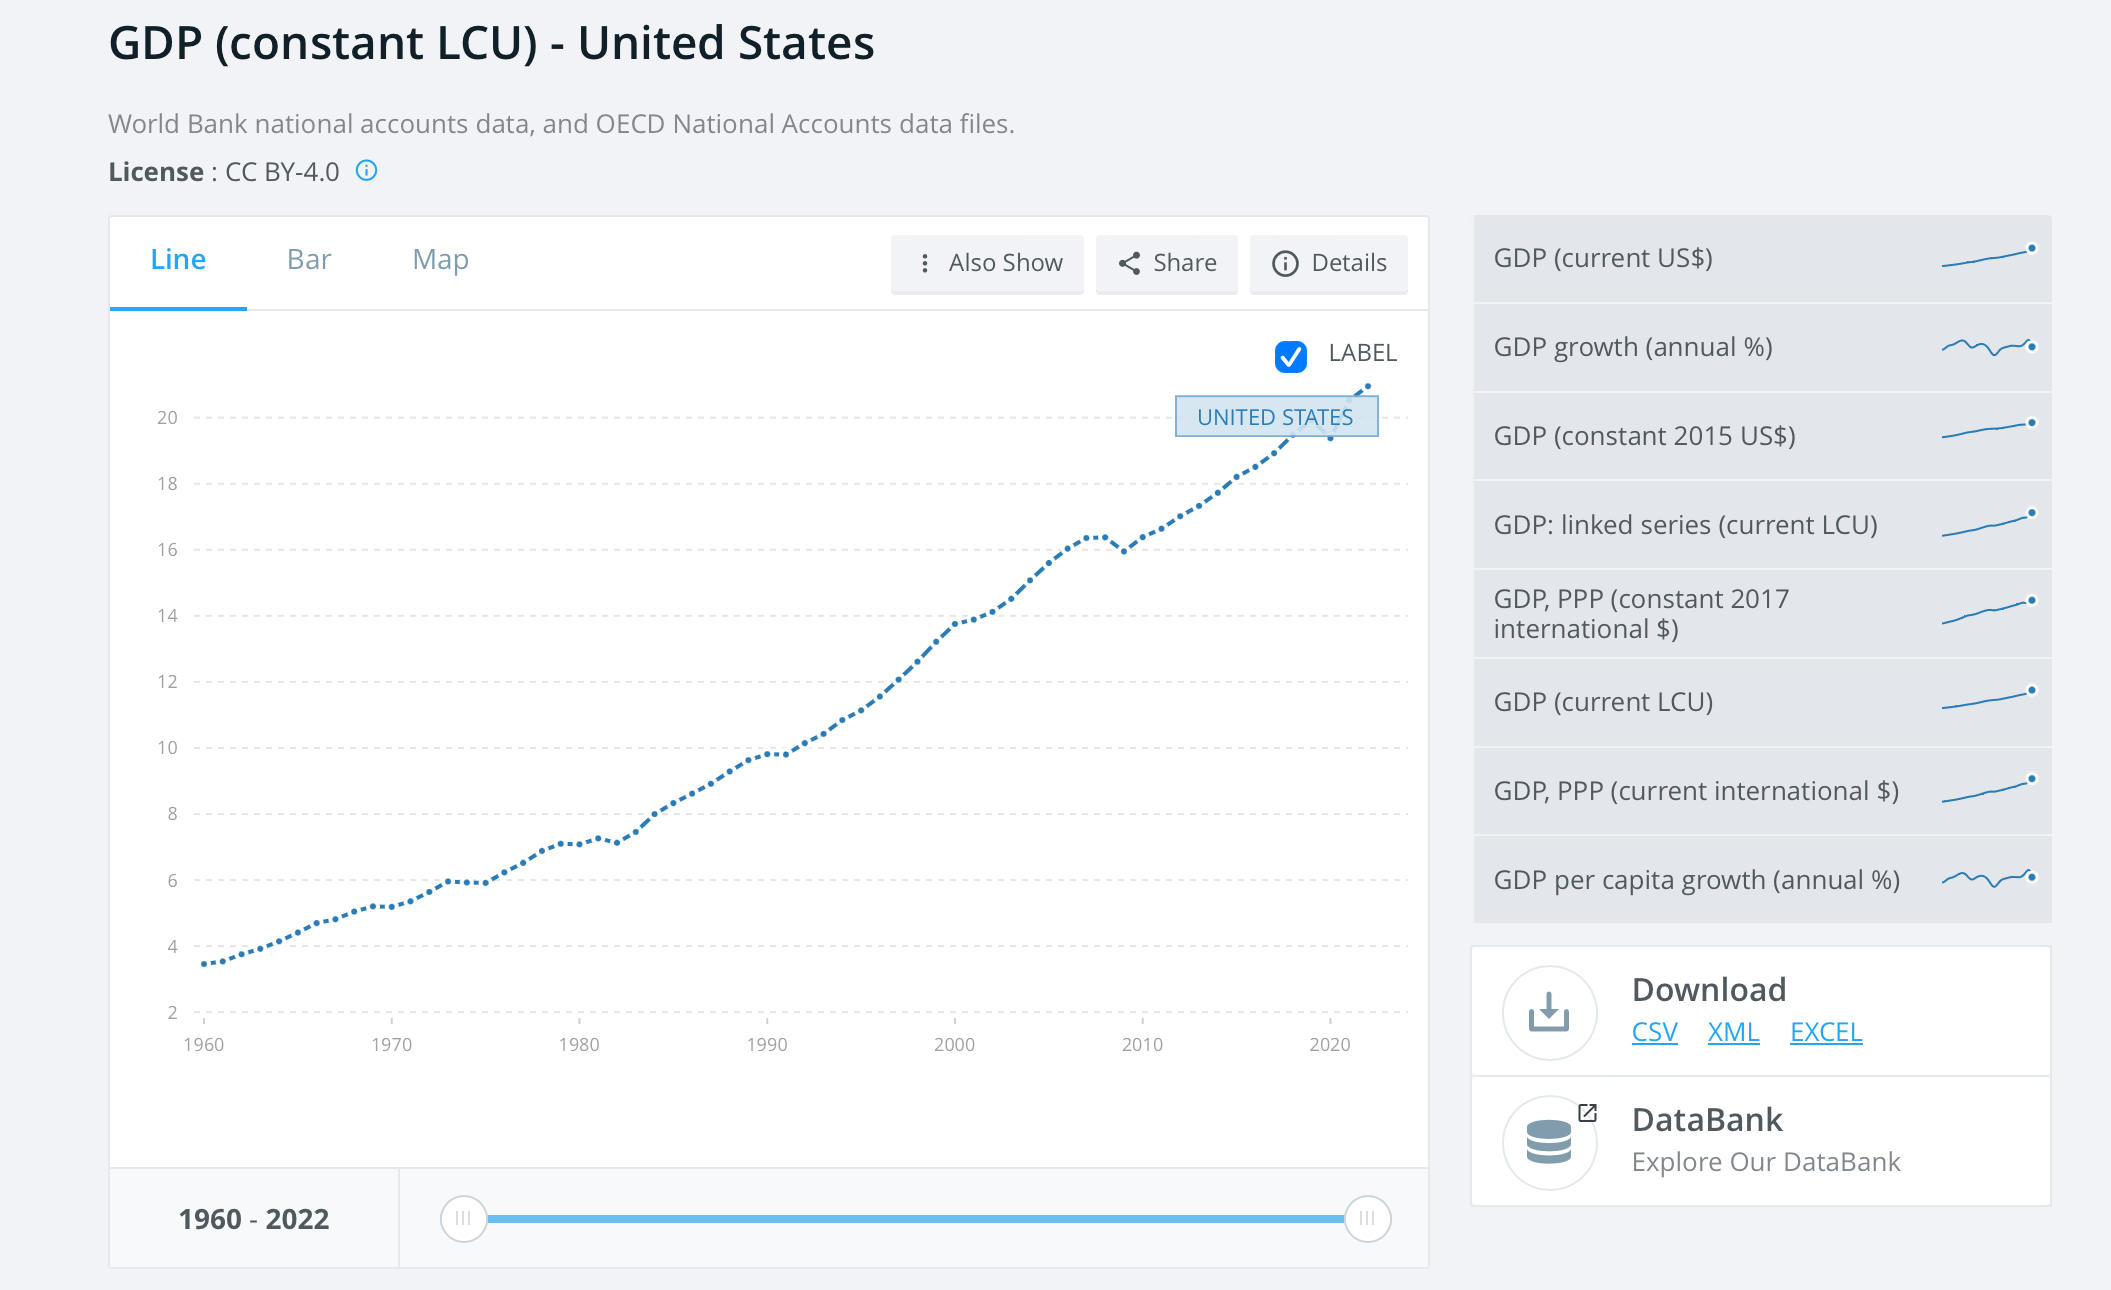
The following two graphs show the data series for nominal and real GDP in the U.S., 1960-2022:
https://data.worldbank.org/indicator/NY.GDP.MKTP.CD?locations=US
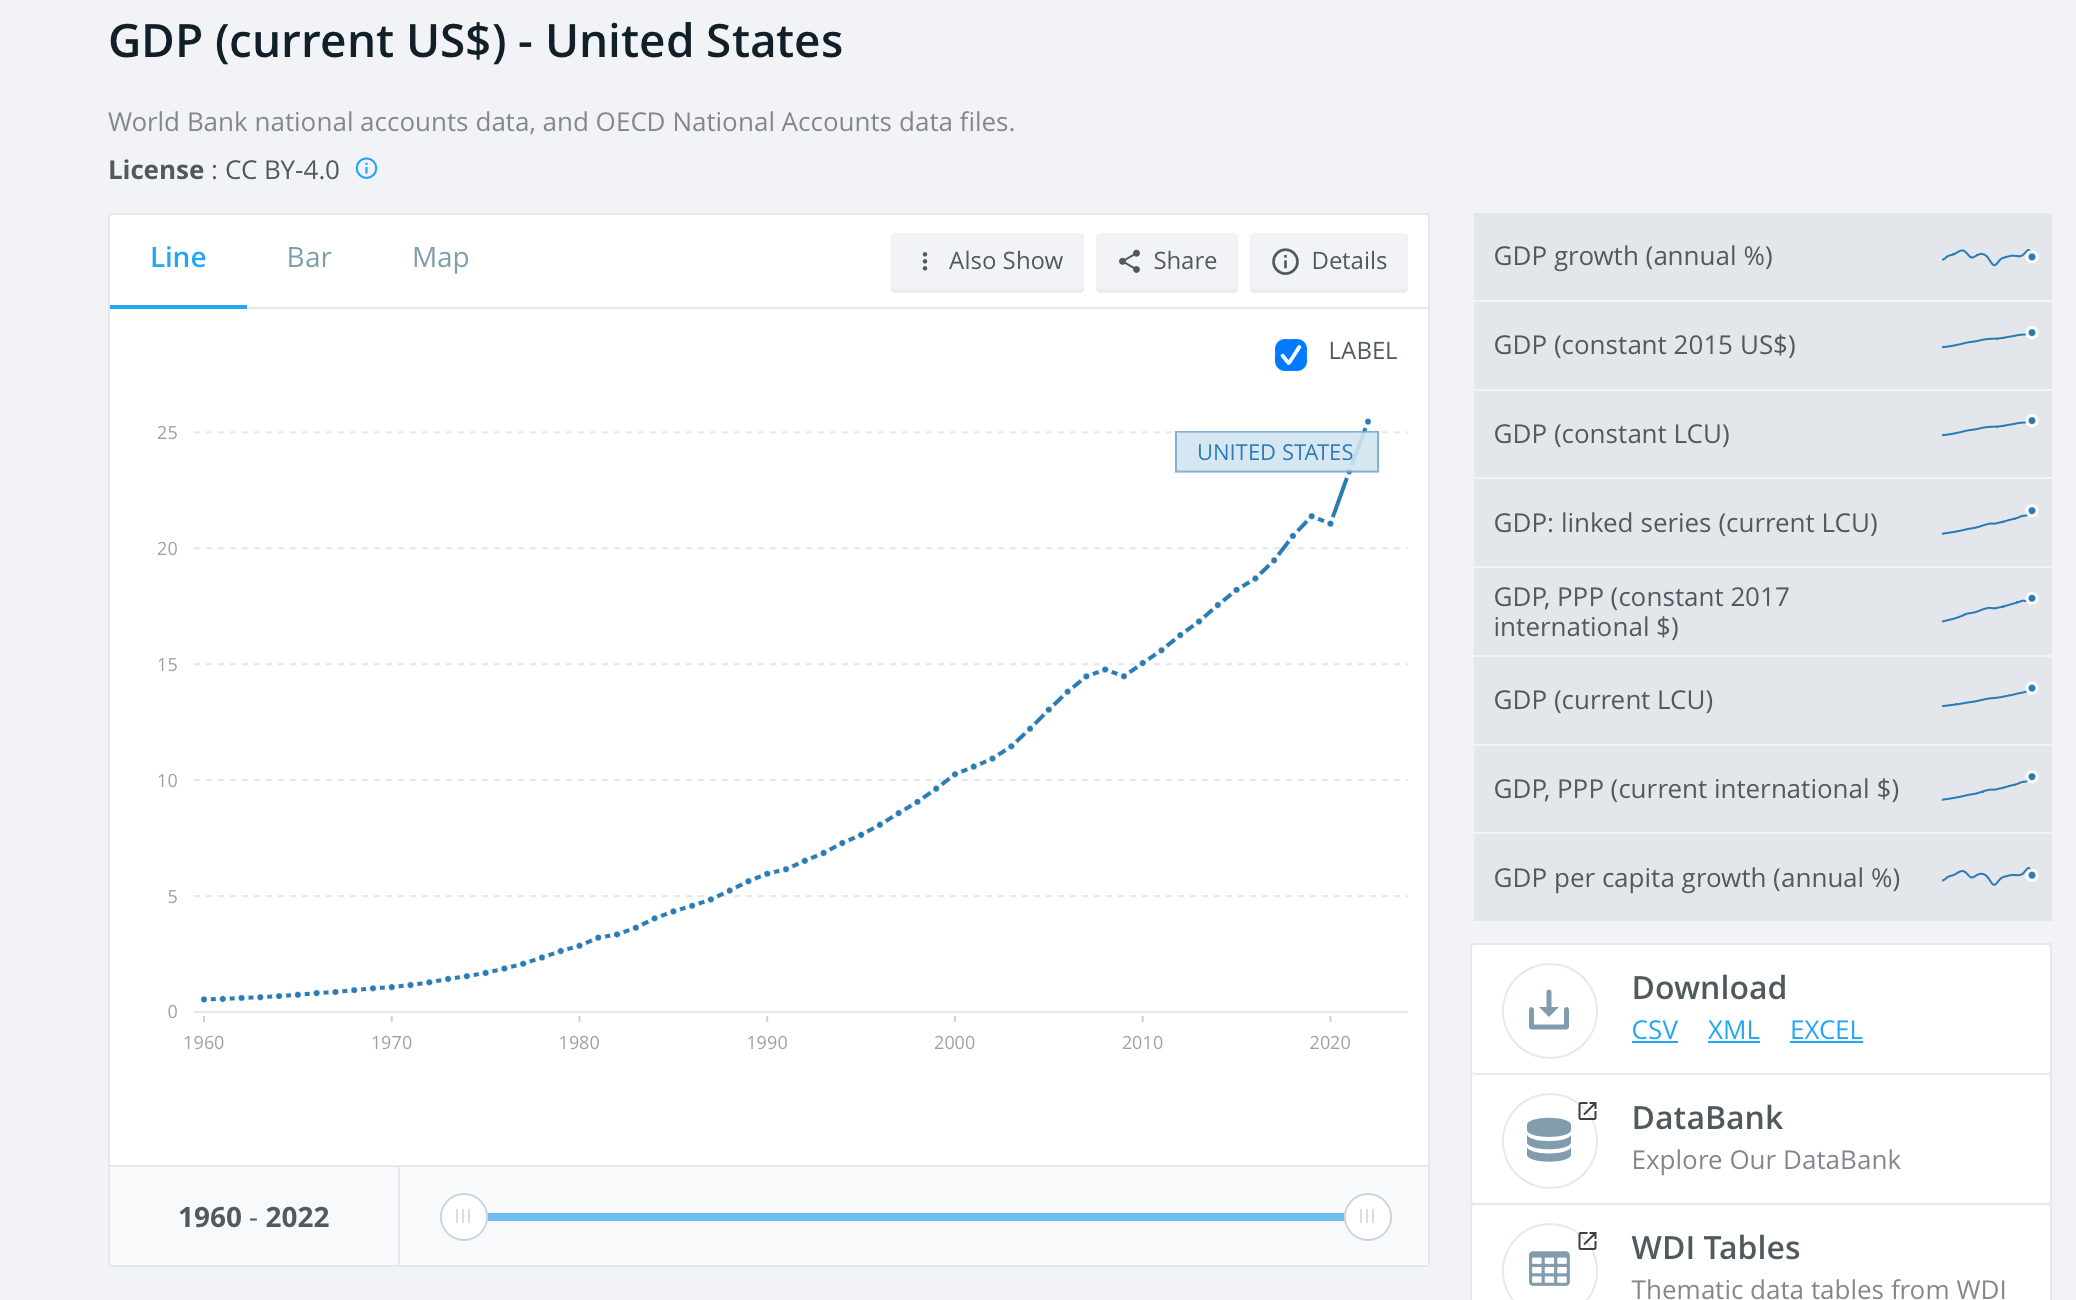
GDP (current US$) - United States World Bank national accounts data, and OECD National Accounts data files. License : CC BY-4.0 @ Line Bar Map : Also Show
Step by Step Solution
There are 3 Steps involved in it
1 Expert Approved Answer
Step: 1 Unlock

Question Has Been Solved by an Expert!
Get step-by-step solutions from verified subject matter experts
Step: 2 Unlock
Step: 3 Unlock