

Question: The forecasts generated by two forecasting methods and actual sales have been collected in the Microsoft Excel Online file below. Use the Microsoft Excel Online
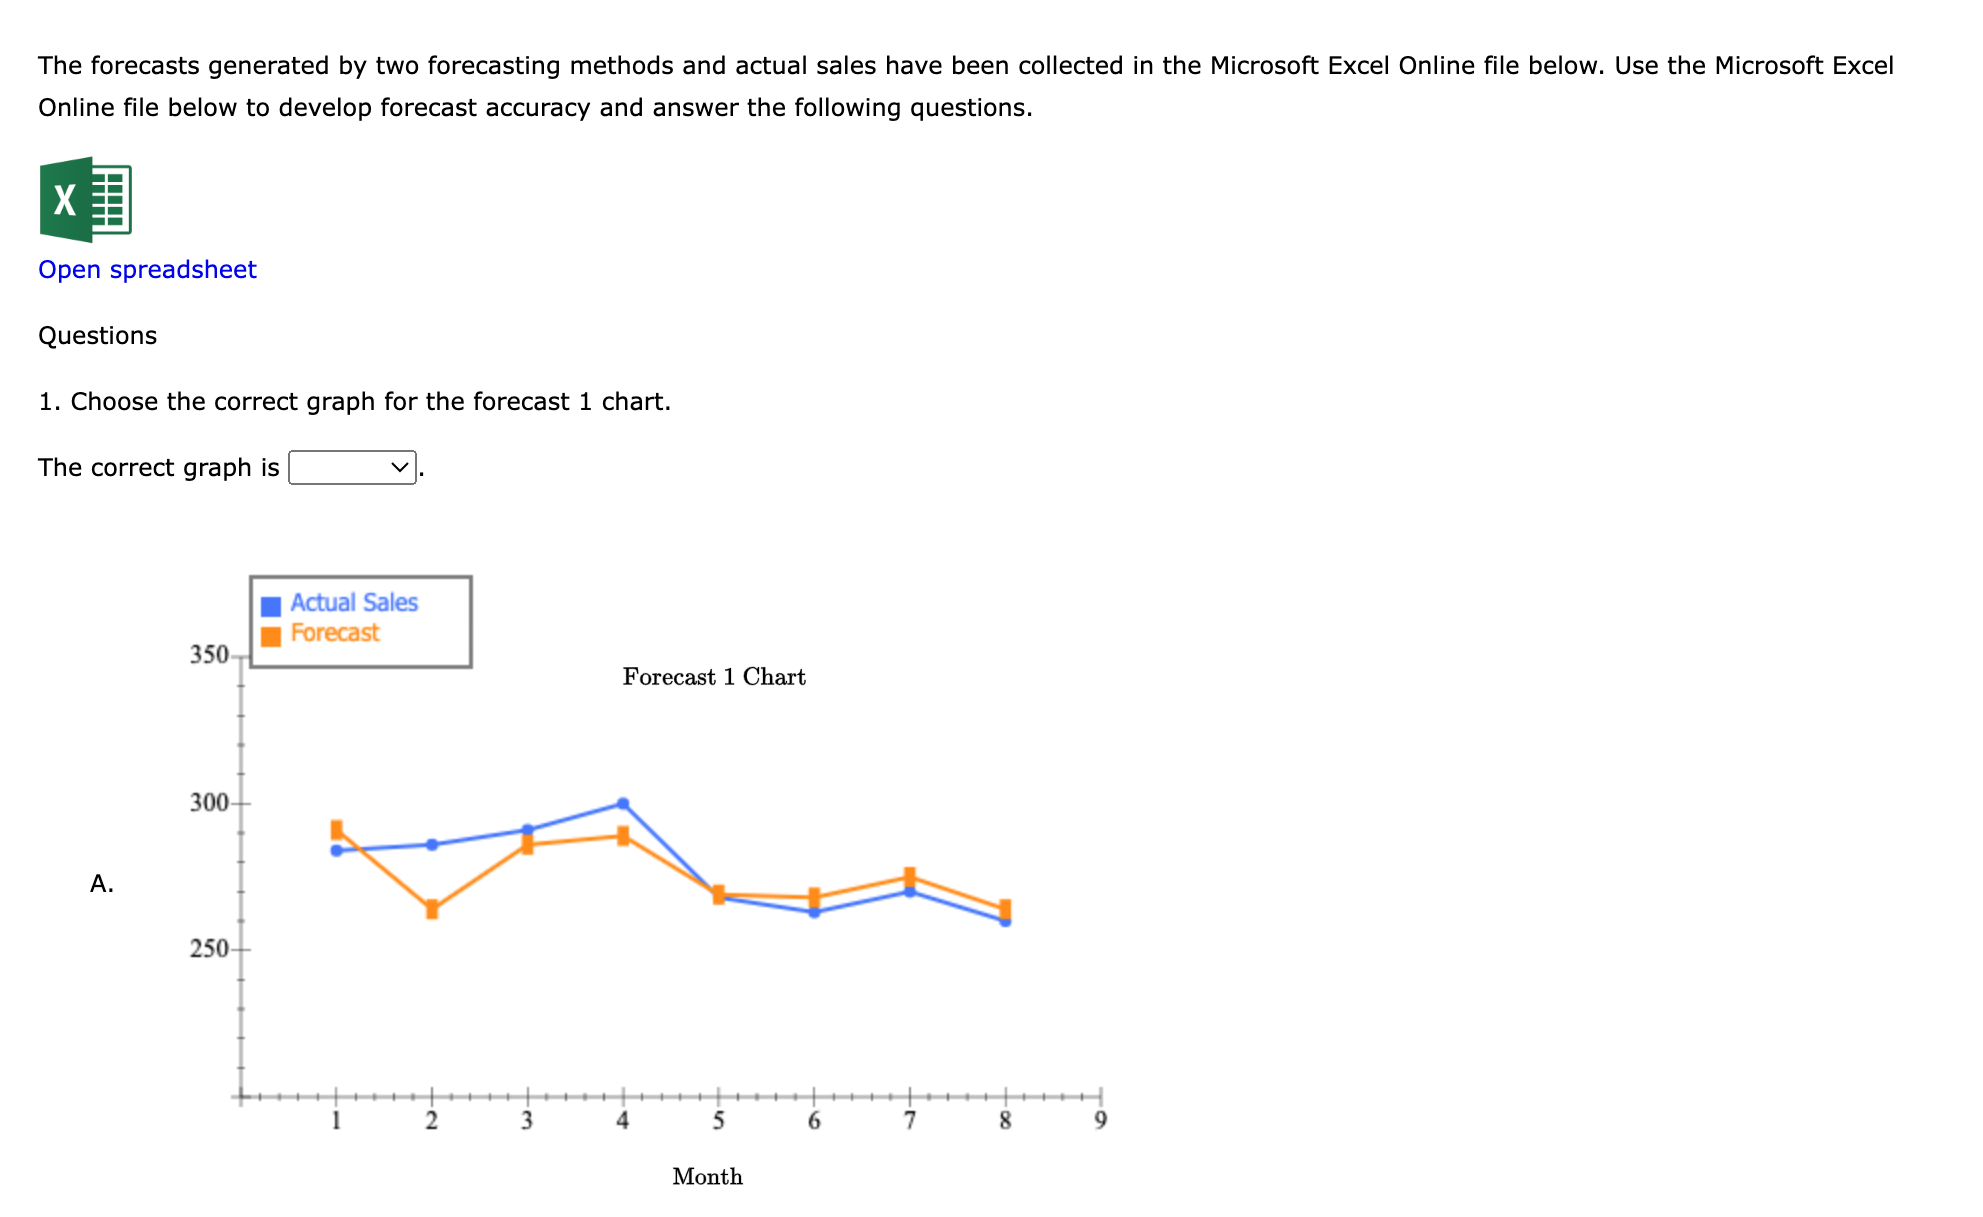
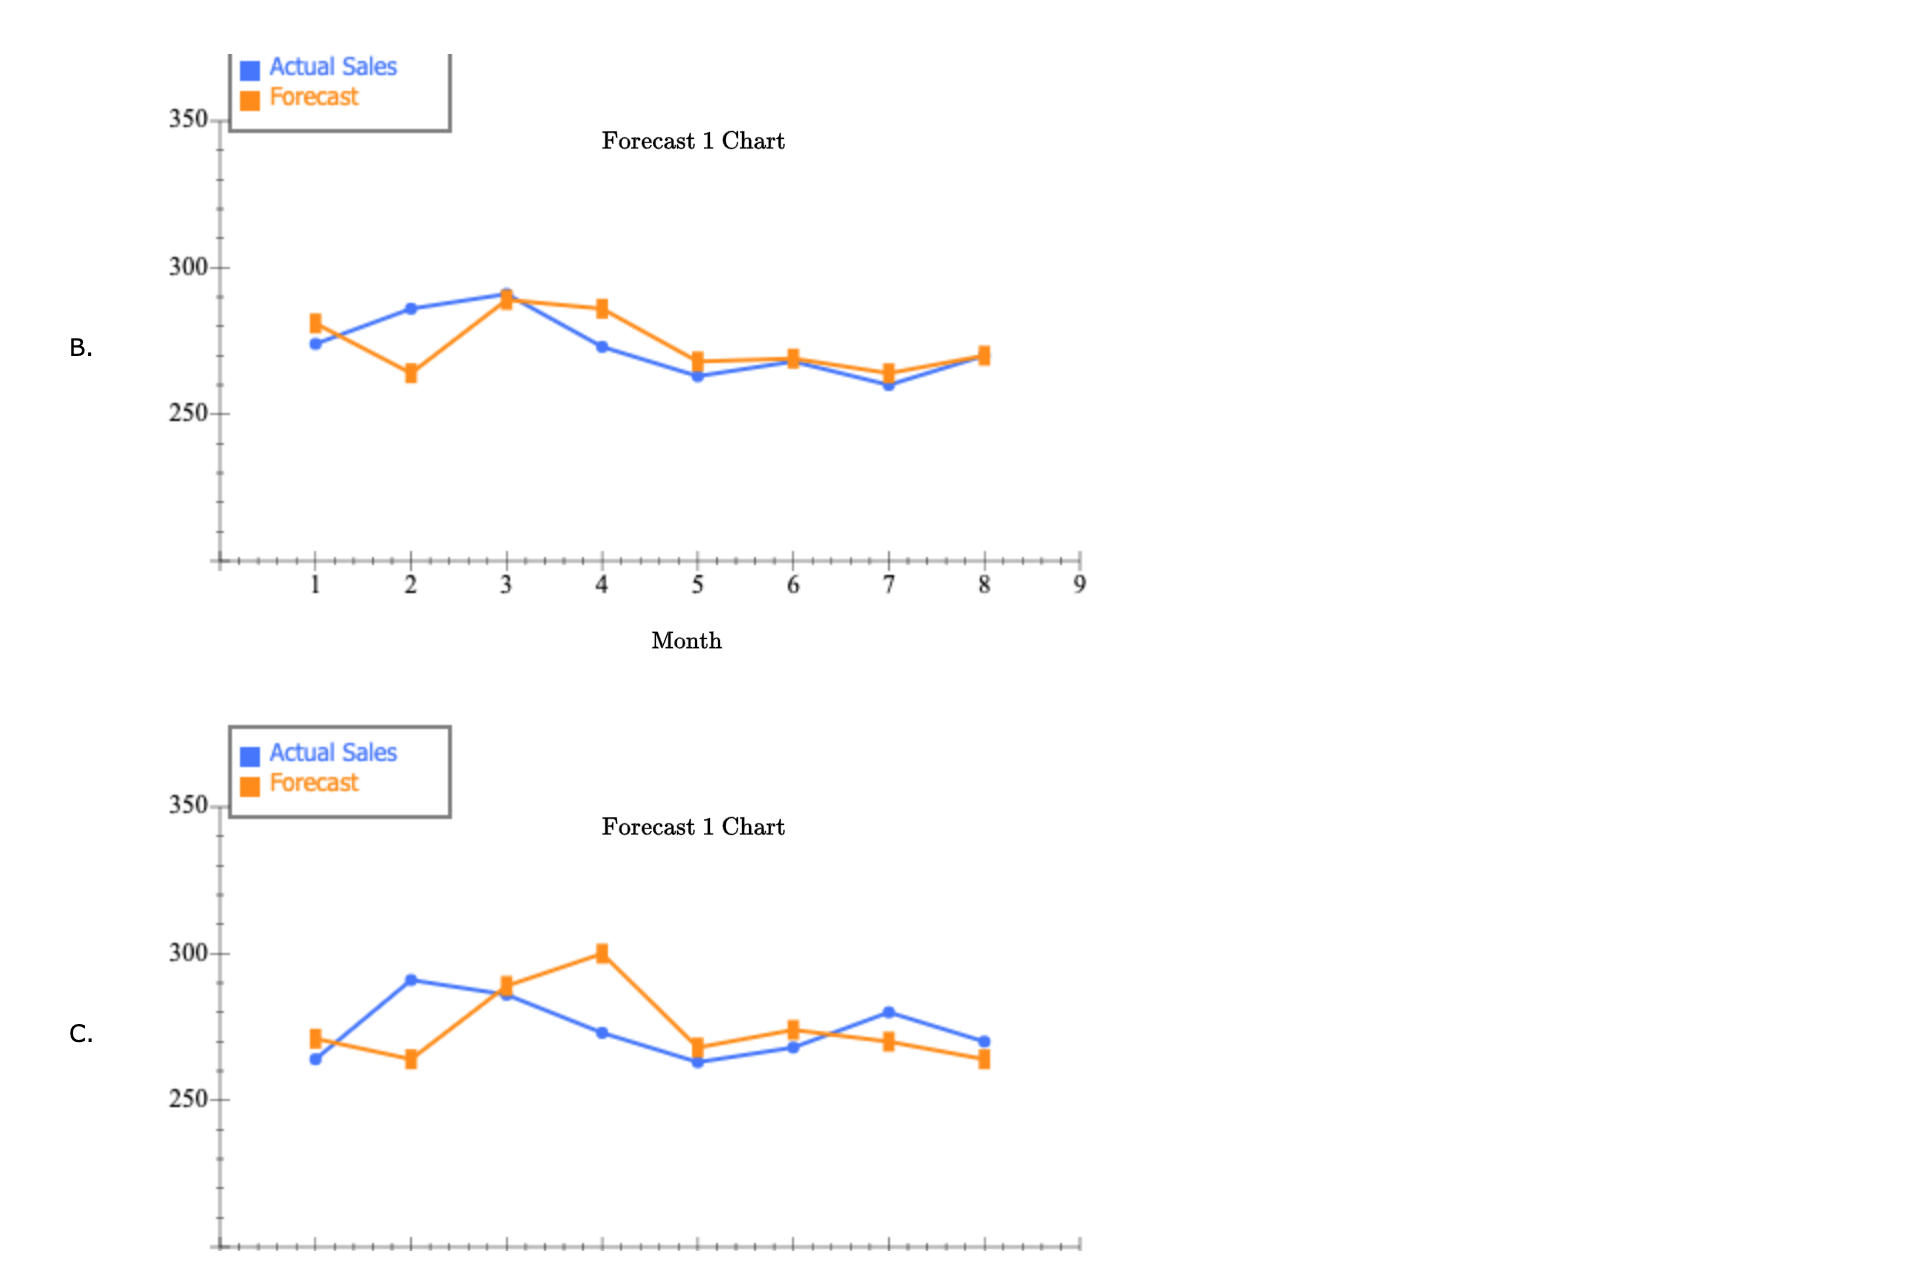
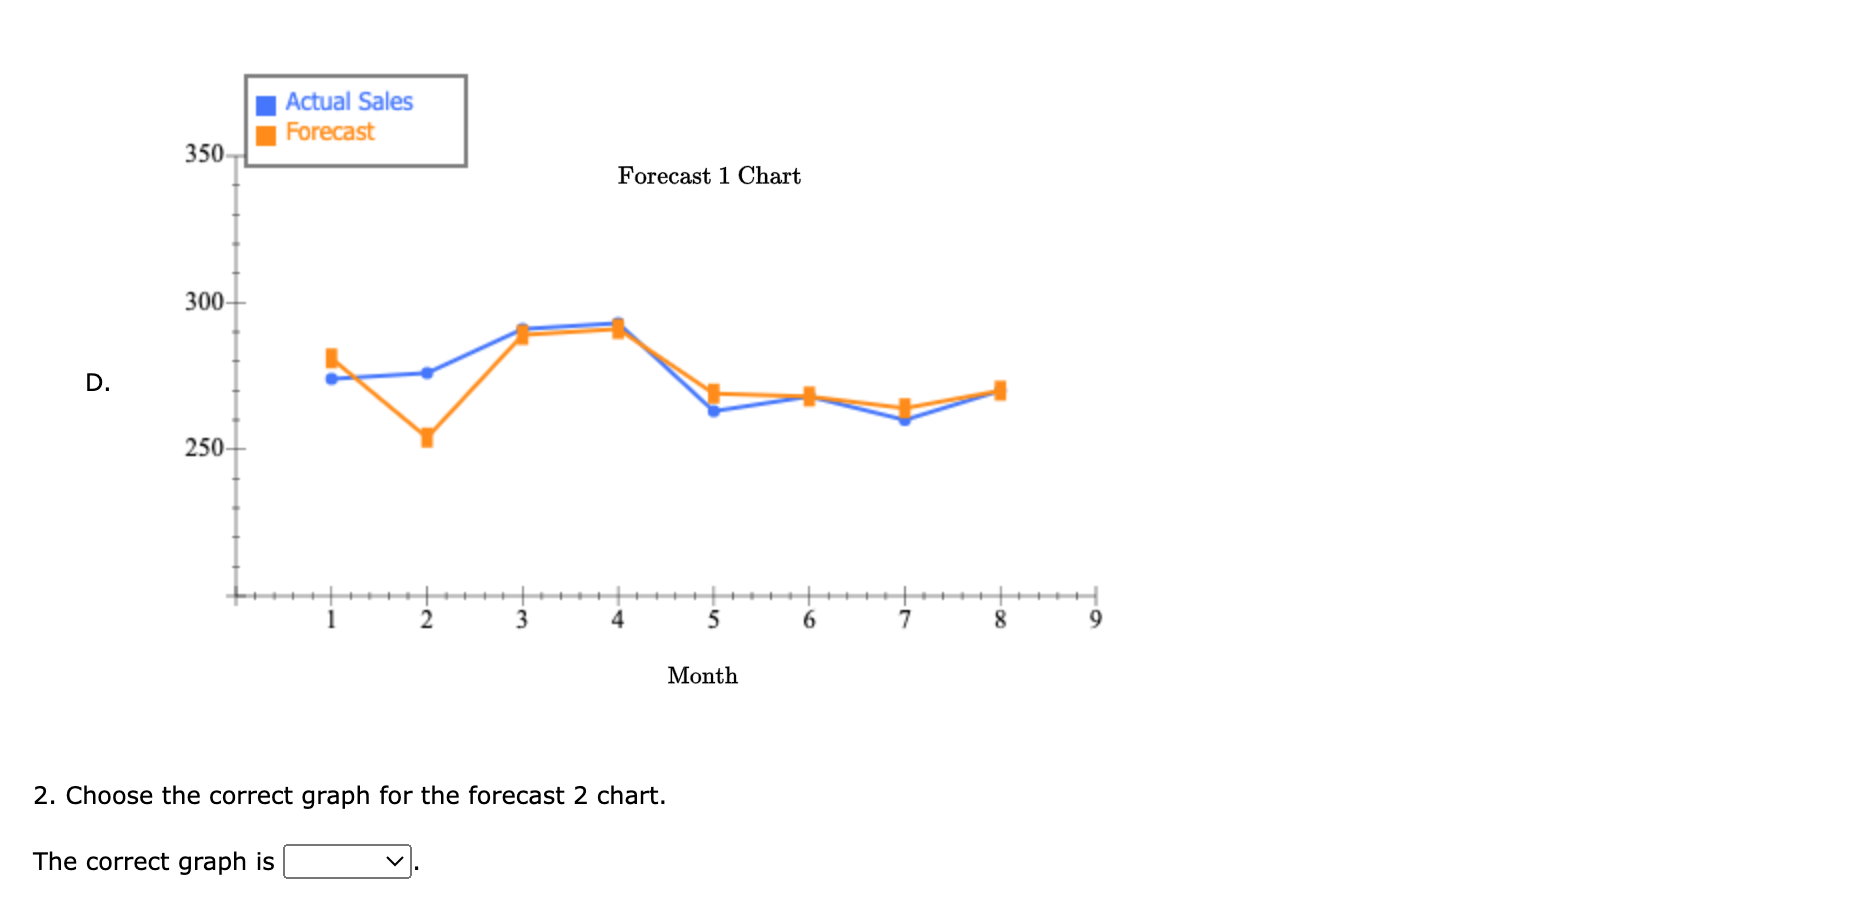
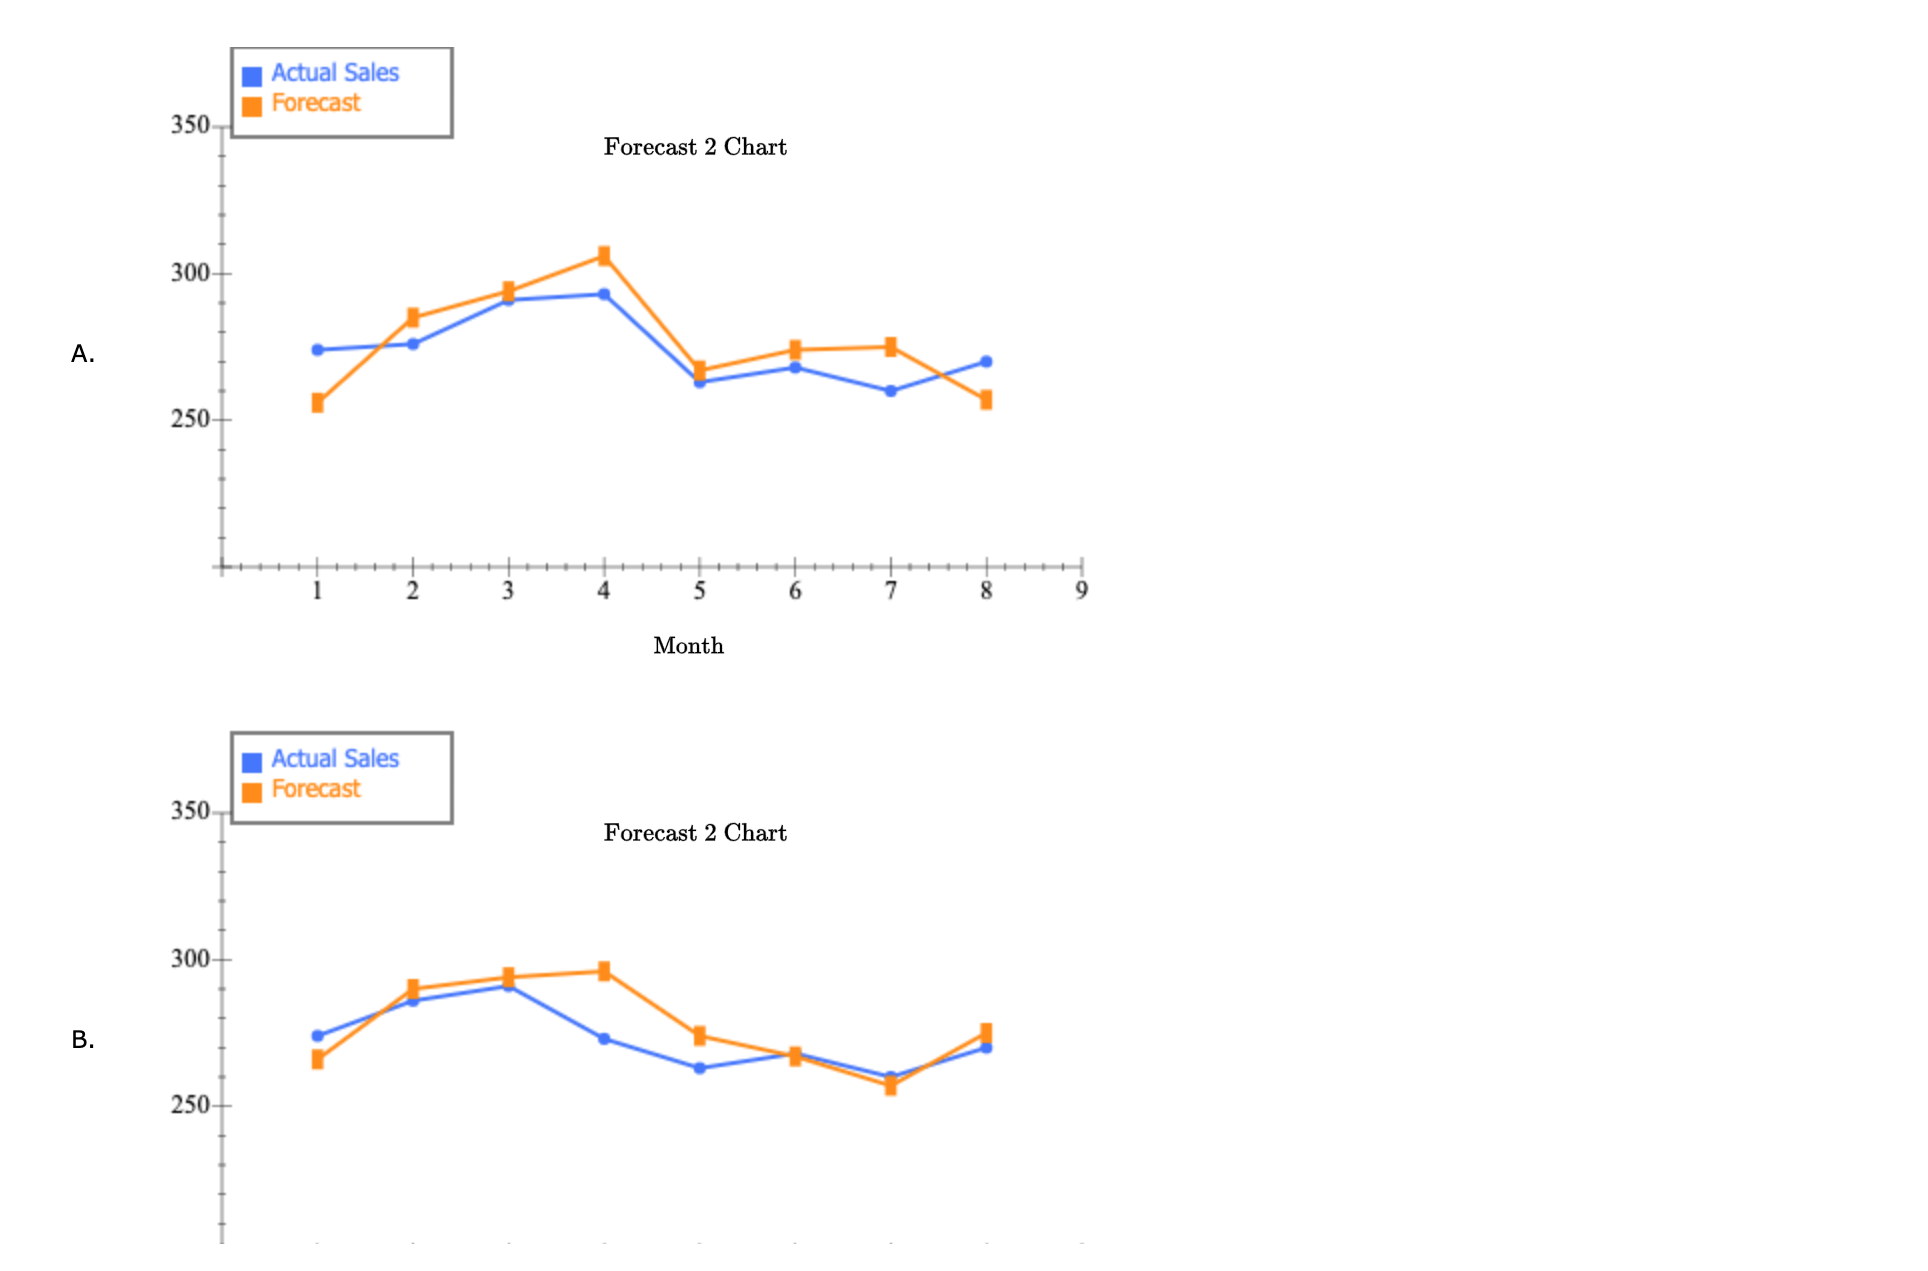
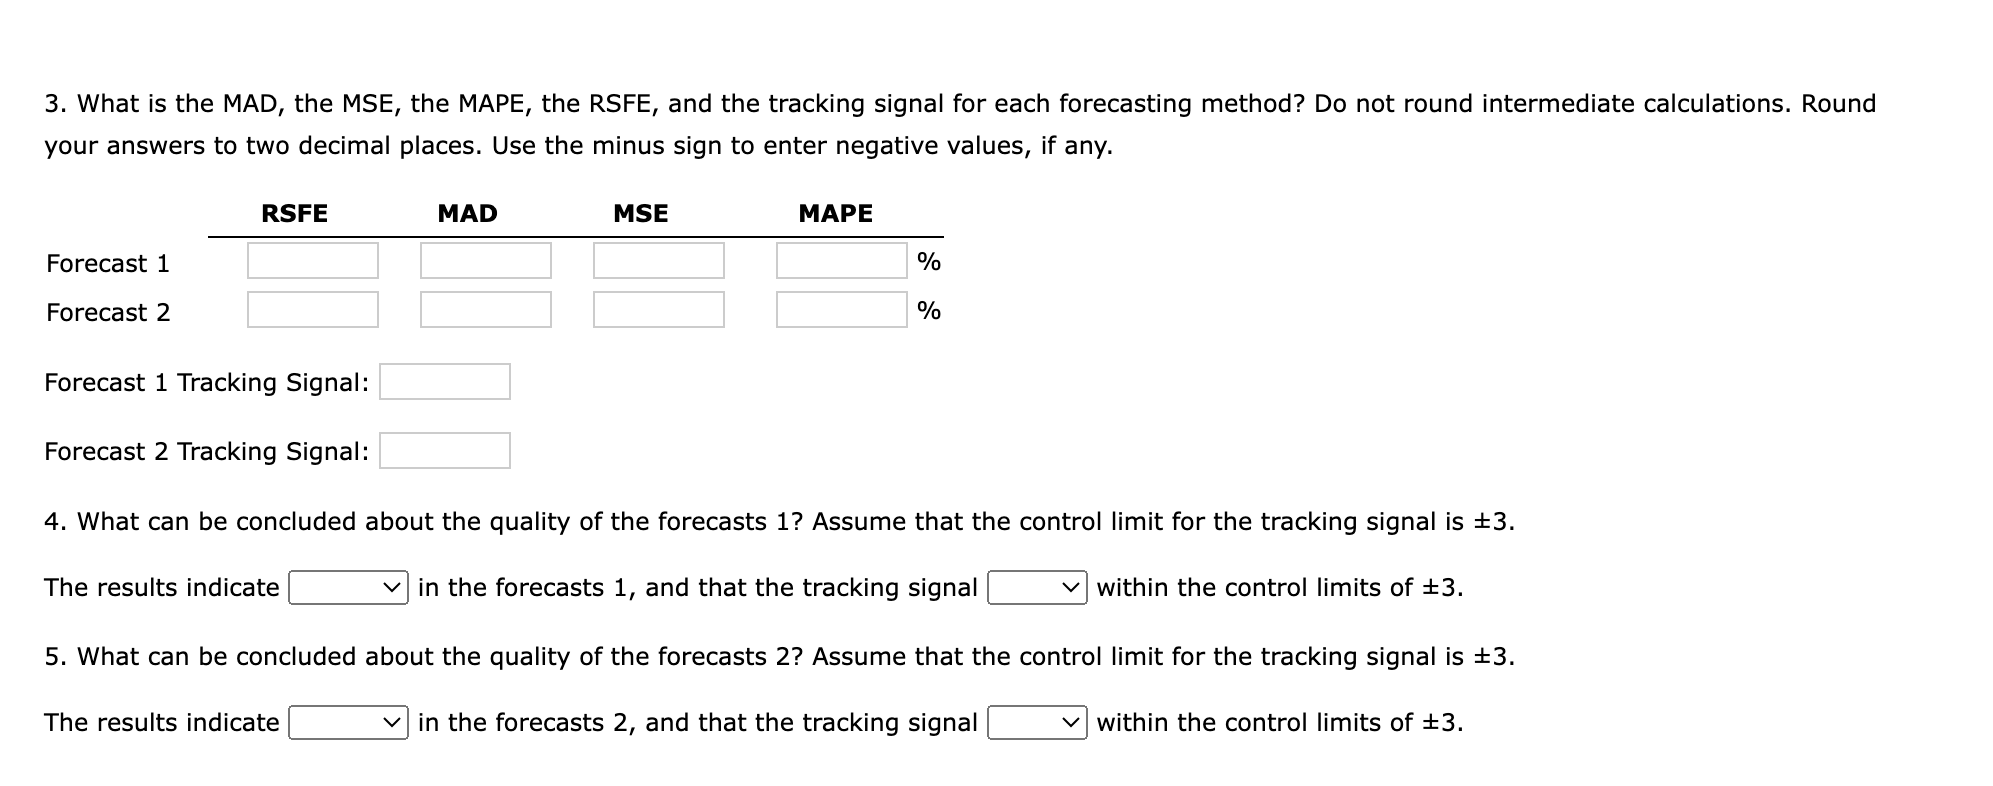
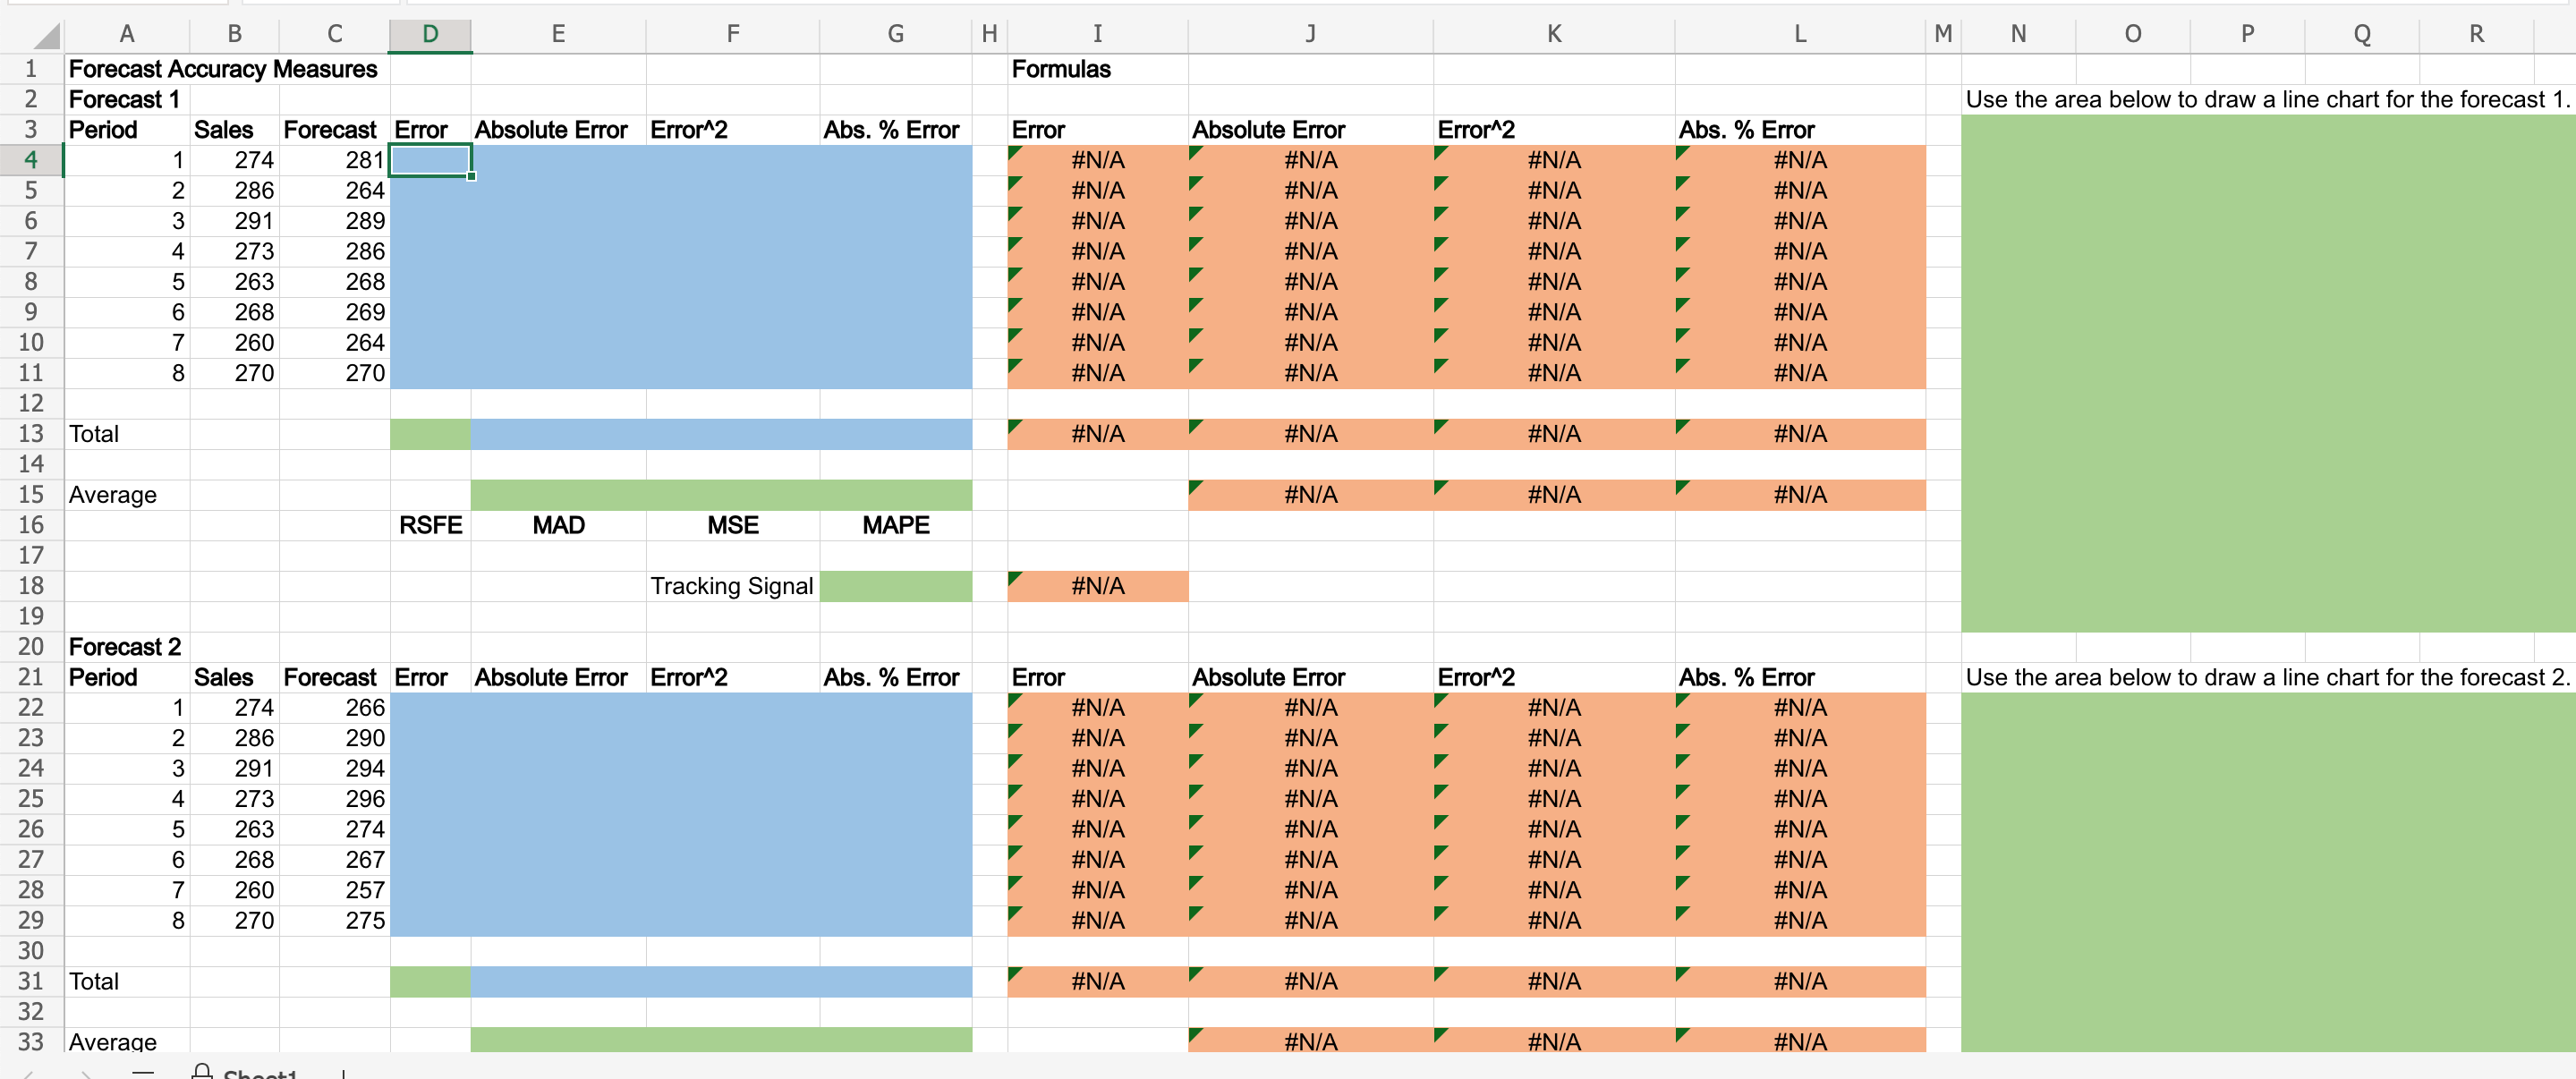
The forecasts generated by two forecasting methods and actual sales have been collected in the Microsoft Excel Online file below. Use the Microsoft Excel Online file below to develop forecast accuracy and answer the following questions. Open spreadsheet Questions 1. Choose the correct graph for the forecast 1 chart. The correct graph is 2. Choose the correct graph for the forecast 2 chart. The correct graph is 3. What is the MAD, the MSE, the MAPE, the RSFE, and the tracking signal for each forecasting method? Do not round intermediate calculations. Round your answers to two decimal places. Use the minus sign to enter negative values, if any. Forecast 1 Tracking Signal: Forecast 2 Tracking Signal: 4. What can be concluded about the quality of the forecasts 1 ? Assume that the control limit for the tracking signal is \pm 3 . The results indicate in the forecasts 1 , and that the tracking signal within the control limits of \pm 3 . 5. What can be concluded about the quality of the forecasts 2 ? Assume that the control limit for the tracking signal is \pm 3 . The results indicate in the forecasts 2 , and that the tracking signal within the control limits of \pm 3 . B. C. A. B
Step by Step Solution
There are 3 Steps involved in it

Get step-by-step solutions from verified subject matter experts