Question: The forecasts generated by two forecasting methods and actual sales have been collected in the Microsoft Excel Online file below. Use the Microsoft Excel Online
The forecasts generated by two forecasting methods and actual sales have been collected in the Microsoft Excel Online file below. Use the Microsoft Excel Online file below to develop forecast accuracy and answer the following questions.
Please help with mistakes for the following:
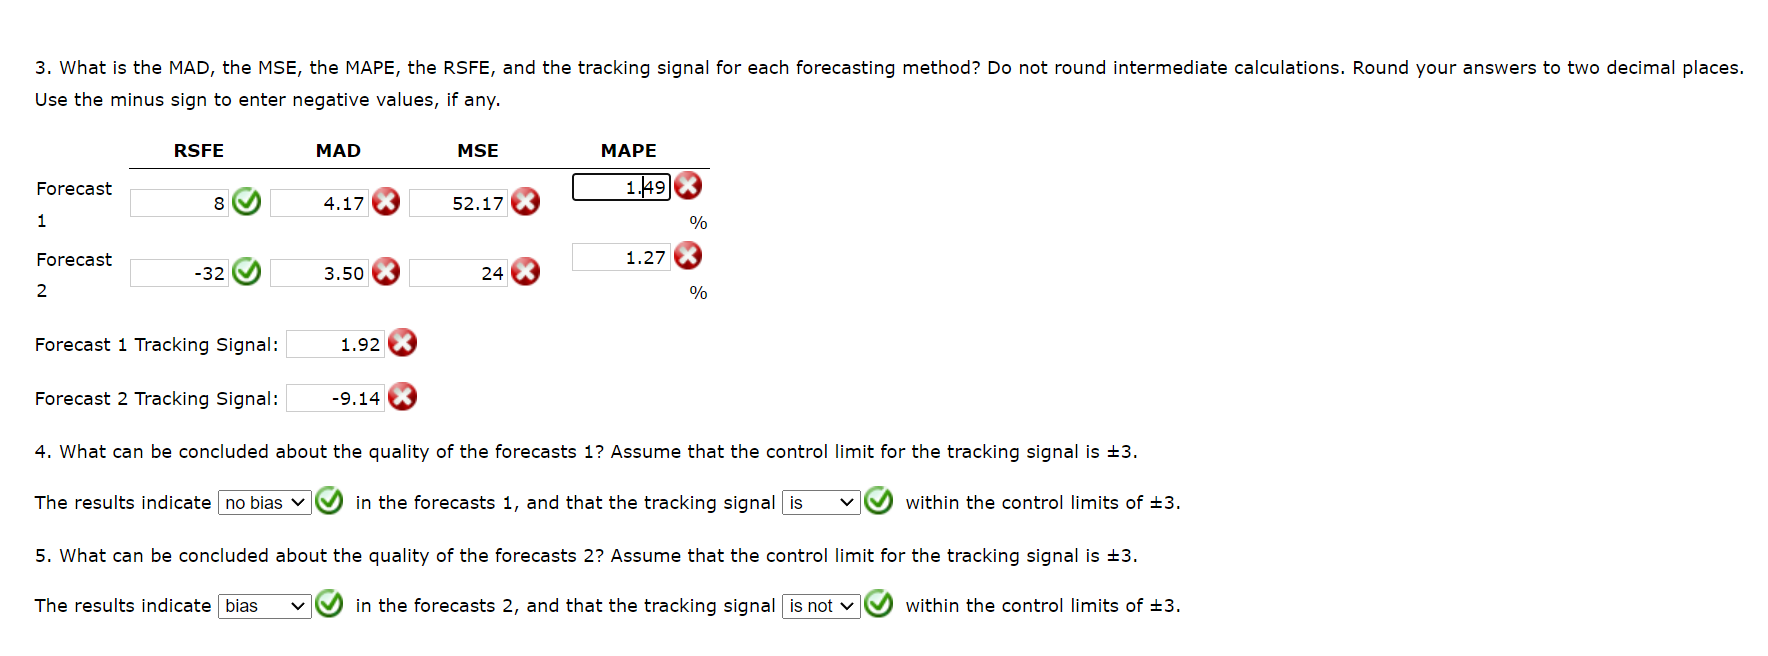
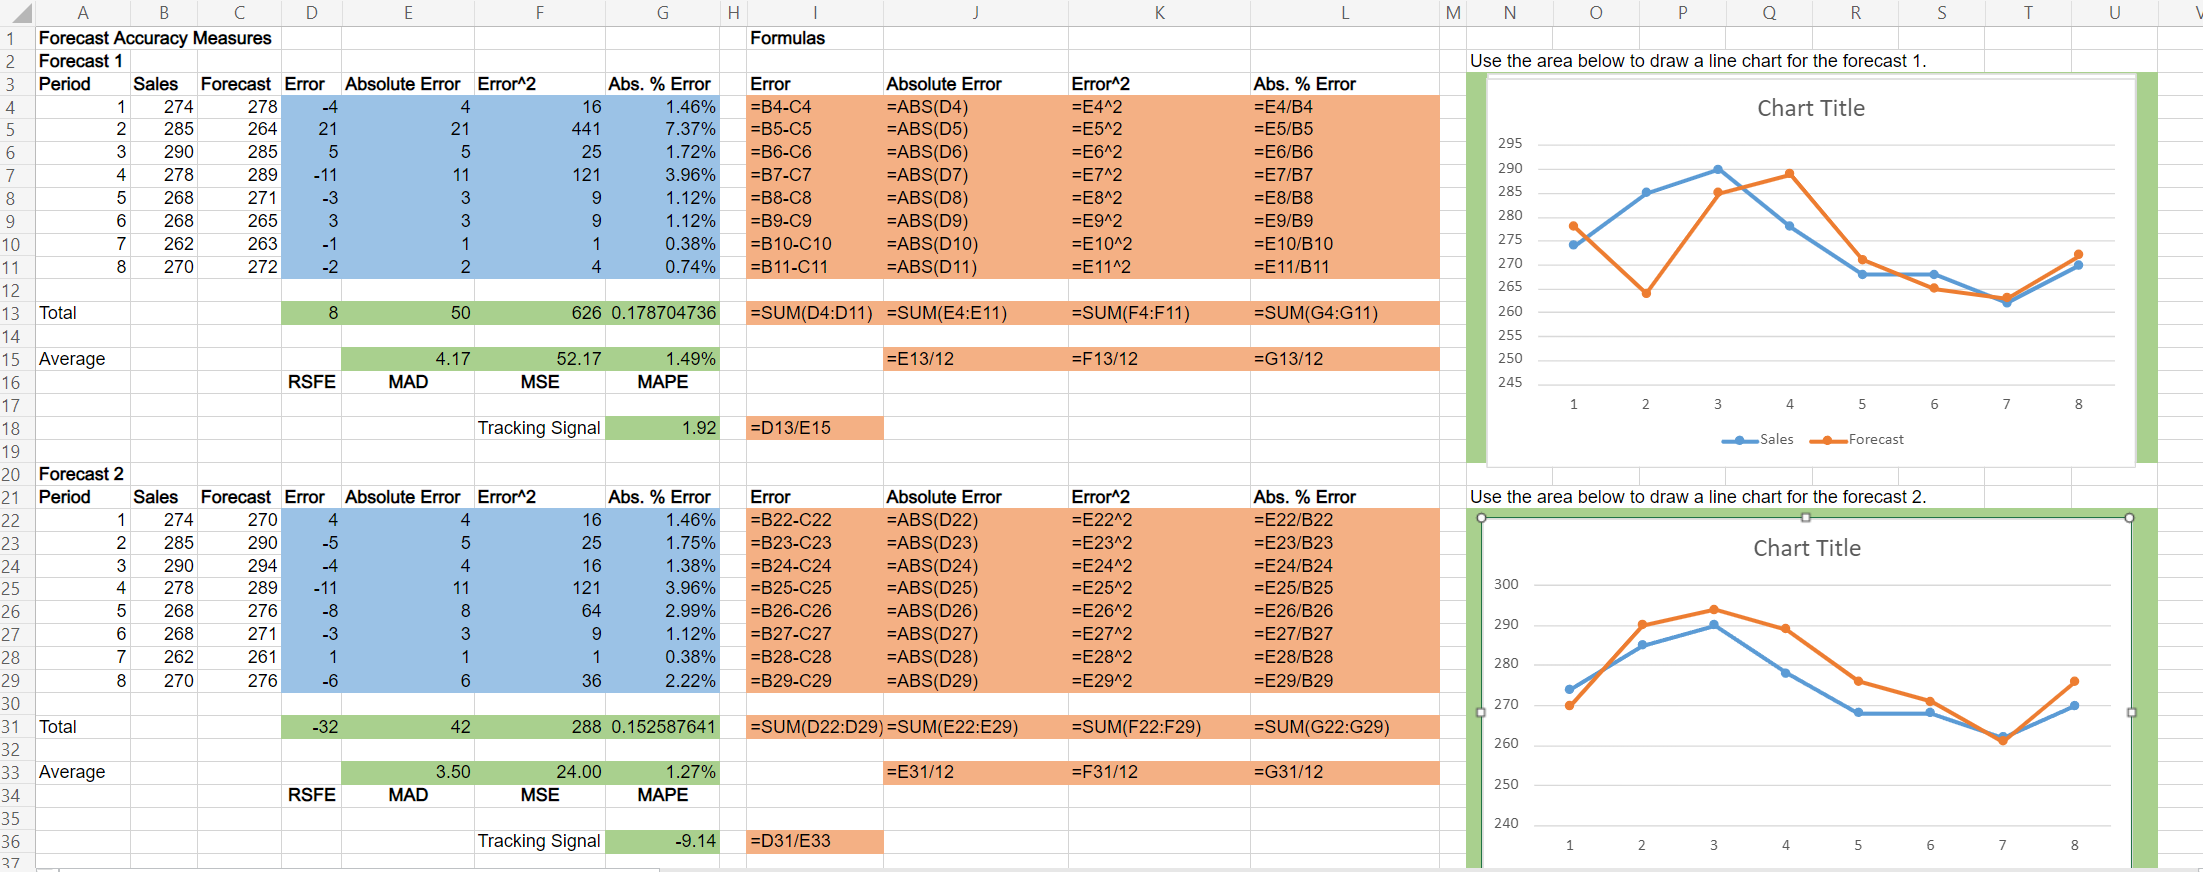
3. What is the MAD, the MSE, the MAPE, the RSFE, and the tracking signal for each forecasting method? Do not round intermediate calculations. Round your answers to two decimal places. Use the minus sign to enter negative values, if any. RSFE MAD MSE MAPE Forecast 1.49 8 4.17 52.17 1 % Forecast 1.27 -32 3.50 24 2 % Forecast 1 Tracking Signal: 1.92 Forecast 2 Tracking Signal: -9.14 4. What can be concluded about the quality of the forecasts 1? Assume that the control limit for the tracking signal is +3. The results indicate no bias v in the forecasts 1, and that the tracking signal is within the control limits of +3. 5. What can be concluded about the quality of the forecasts 2? Assume that the control limit for the tracking signal is +3. The results indicate bias in the forecasts 2, and that the tracking signal is notv within the control limits of +3. . H K L M N P Q R S T U Formulas Use the area below to draw a line chart for the forecast 1. Chart Title 295 290 Error =B4-C4 =B5-C5 =B6-C6 =B7-C7 =B8-C8 =B9-09 =B10-C10 =B11-C11 Absolute Error =ABS(D4) =ABS(D5) =ABS(D6) =ABS(D7) =ABS(D8) =ABS(D9) =ABS(D10) =ABS(D11) Error^2 =E412 =E5^2 =E6^2 =E7^2 =E8^2 =E9^2 =E10^2 =E1112 Abs. % Error =E4/B4 =E5/B5 =E6/B6 =E7/B7 =E8/B8 =E9/B9 =E10/B10 =E11/B11 290 285 280 275 270 265 =SUM(D4:D11) =SUM(E4:E11) =SUM(F4:F11) =SUM(G4:G11) 260 255 250 =E13/12 =F13/12 =G13/12 245 1 2 3 4 5 6 7 8 =D13/E 15 A B D E G 1 Forecast Accuracy Measures 2 Forecast 1 3 Period Sales Forecast Error Absolute Error Error^2 Abs. % Error 4 1 274 278 -4 4 16 1.46% 5 2 285 264 21 21 441 7.37% 6 3 285 5 5 25 1.72% 7 4 278 289 -11 11 121 3.96% 8 5 268 271 -3 3 9 1.12% 9 6 268 265 3 3 9 1.12% 10 7 262 263 -1 1 1 0.38% 11 8 270 272 -2 2 4. 0.74% 12 13 Total 8 50 626 0.178704736 14 15 Average 4.17 52.17 1.49% 16 RSFE MAD MSE MAPE 17 18 Tracking Signal 1.92 19 20 Forecast 2 21 Period Sales Forecast Error Absolute Error Error^2 Abs. % Error 22 274 270 4 4 16 1.46% 23 2 285 290 -5 5 25 1.75% 24 290 294 -4 4 16 1.38% 25 4 278 289 -11 11 3.96% 26 5 268 276 -8 8 64 2.99% 27 6 268 271 -3 3 9 1.12% 28 7 262 261 1 1 0.38% 29 8 270 276 -6 6 36 2.22% 30 31 Total -32 42 288 0.152587641 32 33 Average 3.50 24.00 1.27% 34 RSFE MAD MSE MAPE 35 36 Tracking Signal -9.14 27 -Sales Forecast Use the area below to draw a line chart for the forecast 2. Chart Title 121 Error =B22-C22 =B23-C23 =B24-C24 =B25-C25 =B26-C26 =B27-C27 =B28-C28 =B29-C29 5 418 31 6 Absolute Error =ABS(D22) =ABS(D23) =ABS(D24) =ABS(D25) =ABS(D26) =ABS(D27) =ABS(D28) =ABS(D29) Error2 =E2212 =E23^2 =E2412 =E25^2 =E2642 =E27^2 =E28^2 =E2942 Abs. % Error =E22/B22 =E23/B23 =E24/B24 =E25/B25 =E26/B26 =E27/B27 =E28/B28 =E29/B29 300 290 280 270 =SUM(D22:D29) =SUM(E22:E29) =SUM(F22:F29) =SUM(G22:G29) 260 =E31/12 =F31/12 =G31/12 250 240 =D31/E33 1 2 5 6 7 8 3. What is the MAD, the MSE, the MAPE, the RSFE, and the tracking signal for each forecasting method? Do not round intermediate calculations. Round your answers to two decimal places. Use the minus sign to enter negative values, if any. RSFE MAD MSE MAPE Forecast 1.49 8 4.17 52.17 1 % Forecast 1.27 -32 3.50 24 2 % Forecast 1 Tracking Signal: 1.92 Forecast 2 Tracking Signal: -9.14 4. What can be concluded about the quality of the forecasts 1? Assume that the control limit for the tracking signal is +3. The results indicate no bias v in the forecasts 1, and that the tracking signal is within the control limits of +3. 5. What can be concluded about the quality of the forecasts 2? Assume that the control limit for the tracking signal is +3. The results indicate bias in the forecasts 2, and that the tracking signal is notv within the control limits of +3. . H K L M N P Q R S T U Formulas Use the area below to draw a line chart for the forecast 1. Chart Title 295 290 Error =B4-C4 =B5-C5 =B6-C6 =B7-C7 =B8-C8 =B9-09 =B10-C10 =B11-C11 Absolute Error =ABS(D4) =ABS(D5) =ABS(D6) =ABS(D7) =ABS(D8) =ABS(D9) =ABS(D10) =ABS(D11) Error^2 =E412 =E5^2 =E6^2 =E7^2 =E8^2 =E9^2 =E10^2 =E1112 Abs. % Error =E4/B4 =E5/B5 =E6/B6 =E7/B7 =E8/B8 =E9/B9 =E10/B10 =E11/B11 290 285 280 275 270 265 =SUM(D4:D11) =SUM(E4:E11) =SUM(F4:F11) =SUM(G4:G11) 260 255 250 =E13/12 =F13/12 =G13/12 245 1 2 3 4 5 6 7 8 =D13/E 15 A B D E G 1 Forecast Accuracy Measures 2 Forecast 1 3 Period Sales Forecast Error Absolute Error Error^2 Abs. % Error 4 1 274 278 -4 4 16 1.46% 5 2 285 264 21 21 441 7.37% 6 3 285 5 5 25 1.72% 7 4 278 289 -11 11 121 3.96% 8 5 268 271 -3 3 9 1.12% 9 6 268 265 3 3 9 1.12% 10 7 262 263 -1 1 1 0.38% 11 8 270 272 -2 2 4. 0.74% 12 13 Total 8 50 626 0.178704736 14 15 Average 4.17 52.17 1.49% 16 RSFE MAD MSE MAPE 17 18 Tracking Signal 1.92 19 20 Forecast 2 21 Period Sales Forecast Error Absolute Error Error^2 Abs. % Error 22 274 270 4 4 16 1.46% 23 2 285 290 -5 5 25 1.75% 24 290 294 -4 4 16 1.38% 25 4 278 289 -11 11 3.96% 26 5 268 276 -8 8 64 2.99% 27 6 268 271 -3 3 9 1.12% 28 7 262 261 1 1 0.38% 29 8 270 276 -6 6 36 2.22% 30 31 Total -32 42 288 0.152587641 32 33 Average 3.50 24.00 1.27% 34 RSFE MAD MSE MAPE 35 36 Tracking Signal -9.14 27 -Sales Forecast Use the area below to draw a line chart for the forecast 2. Chart Title 121 Error =B22-C22 =B23-C23 =B24-C24 =B25-C25 =B26-C26 =B27-C27 =B28-C28 =B29-C29 5 418 31 6 Absolute Error =ABS(D22) =ABS(D23) =ABS(D24) =ABS(D25) =ABS(D26) =ABS(D27) =ABS(D28) =ABS(D29) Error2 =E2212 =E23^2 =E2412 =E25^2 =E2642 =E27^2 =E28^2 =E2942 Abs. % Error =E22/B22 =E23/B23 =E24/B24 =E25/B25 =E26/B26 =E27/B27 =E28/B28 =E29/B29 300 290 280 270 =SUM(D22:D29) =SUM(E22:E29) =SUM(F22:F29) =SUM(G22:G29) 260 =E31/12 =F31/12 =G31/12 250 240 =D31/E33 1 2 5 6 7 8


