

Question: The frequency distribution below represents frequencies Choose the correct histogram below of actual low temperatures recorded during the course of a 31-day month. Use the
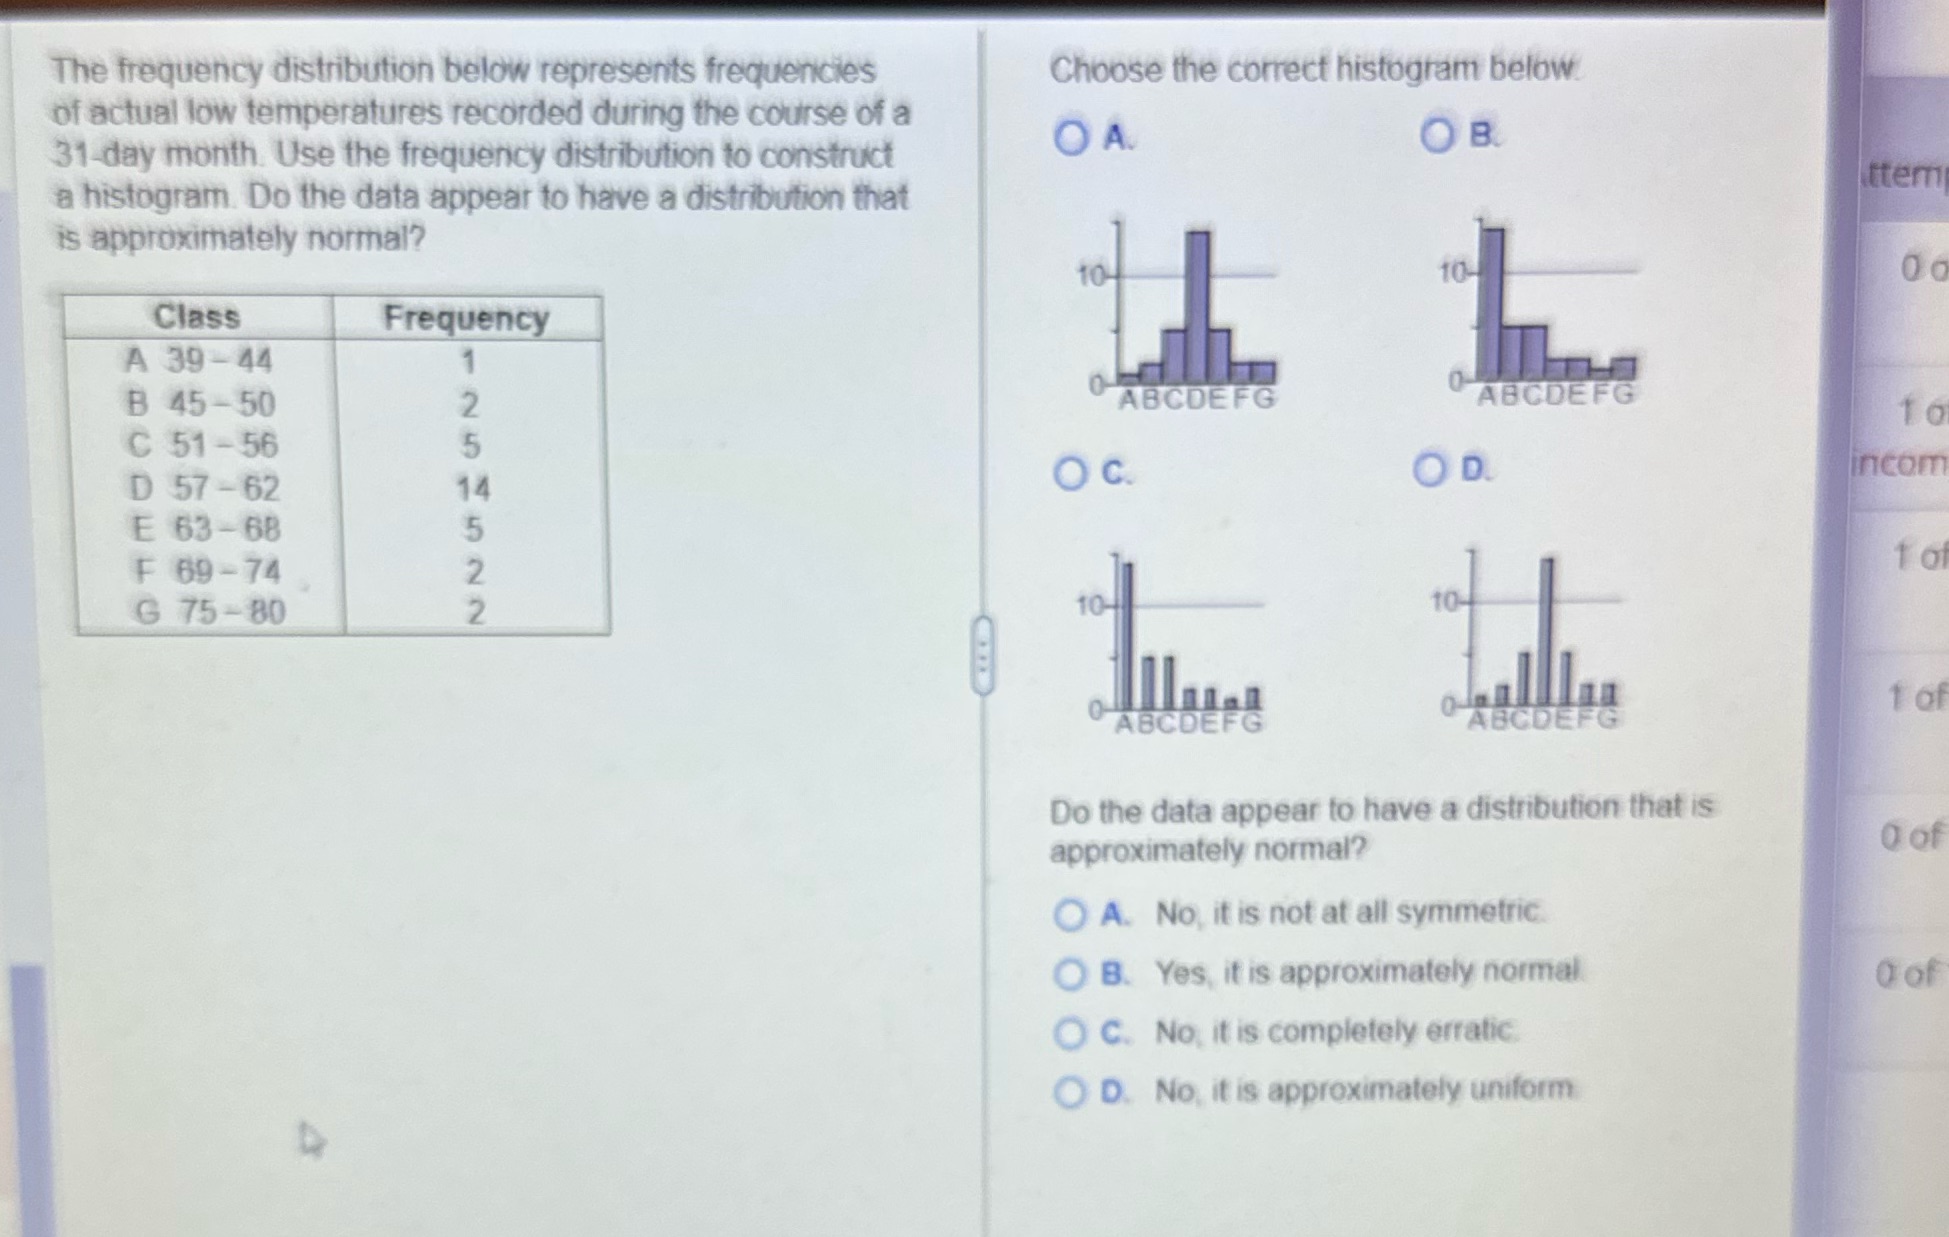
The frequency distribution below represents frequencies Choose the correct histogram below of actual low temperatures recorded during the course of a 31-day month. Use the frequency distribution to construct OA O B a histogram. Do the data appear to have a distribution that item is approximately normal? Class Frequency A 39 44 B 45-50 ABCDEFG ABCDEFG 10 C 51-56 D 57 -62 OC. OD. incom NNURUN E 63-68 F 69-74 to G 75-80 to- ABCDEFG ABCDEFG 1 of Do the data appear to have a distribution that is approximately normal? O of O A. No, it is not at all symmetric B. Yes, it is approximately normal a of O C. No, it is completely erratic. O D. No, it is approximately uniform
Step by Step Solution
There are 3 Steps involved in it

Get step-by-step solutions from verified subject matter experts