

Question: The function G(x)= -0.01x2 +x+63 models the wage gap, as a percent, x years after 1980 in Country A. The graph of function G
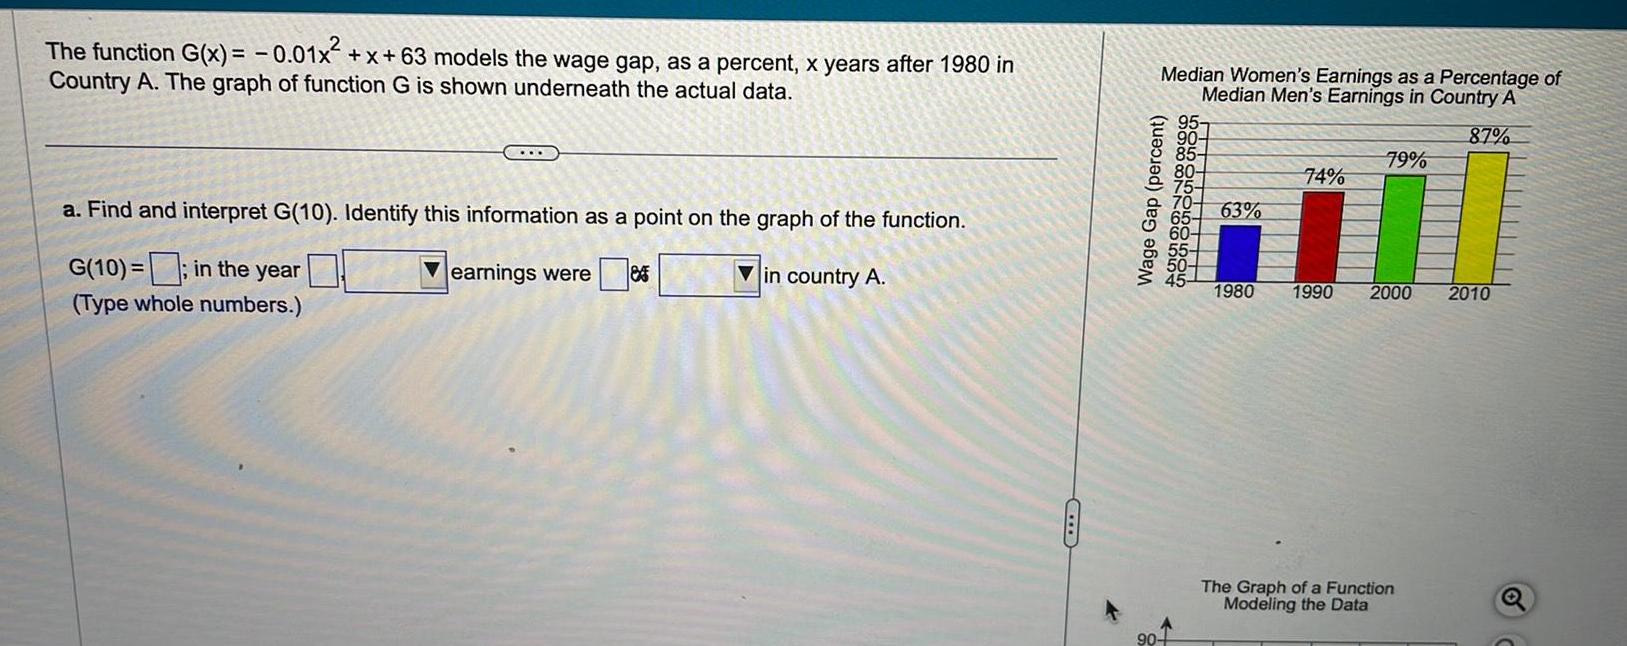
The function G(x)= -0.01x2 +x+63 models the wage gap, as a percent, x years after 1980 in Country A. The graph of function G is shown underneath the actual data. Median Women's Earnings as a Percentage of Median Men's Earnings in Country A a. Find and interpret G(10). Identify this information as a point on the graph of the function. G(10) in the year (Type whole numbers.) earnings were 8 in country A. Wage Gap (percent) 95- 90- 87% 85 79% 80- 74% 75 70 63% 65 60- 55 50- 45 1980 1990 2000 2010 90 The Graph of a Function Modeling the Data Q
Step by Step Solution
There are 3 Steps involved in it

Get step-by-step solutions from verified subject matter experts