

The General Social Survey collects data on demographics, education, and work, among many other characteristics of US
Question:
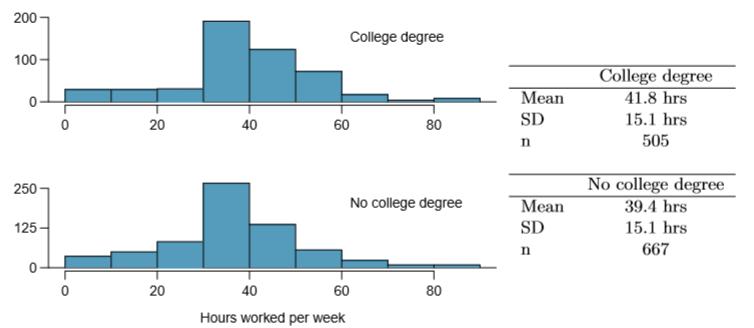
The General Social Survey collects data on demographics, education, and work, among many other characteristics of US residents. The histograms below display the distributions of hours worked per week for two education groups: those with and without a college degree. Suppose we want to estimate the average difference between the number of hours worked per week by all Americans with a college degree and those without a college degree. Summary information for each group is shown in the tables.
(a) What is the parameter of interest, and what is the point estimate?
(b) Are conditions satisfied for estimating this difference using a confidence interval?
(c) Create a 95% confidence interval for the difference in a number of hours worked between the two groups, and interpret the interval in context.
(d) Can you think of any real-world justification for your results? (Note: There isn't a single correct answer to this question.)
Expert Answer:


Statistics The Art and Science of Learning from Data
ISBN: 978-0321755940
3rd edition
Authors: Alan Agresti, Christine A. Franklin
