

Question: The German Credit data set contains observations on 30 variables for 1000 past applicants for credit. Each applicant was rated as good credit (700
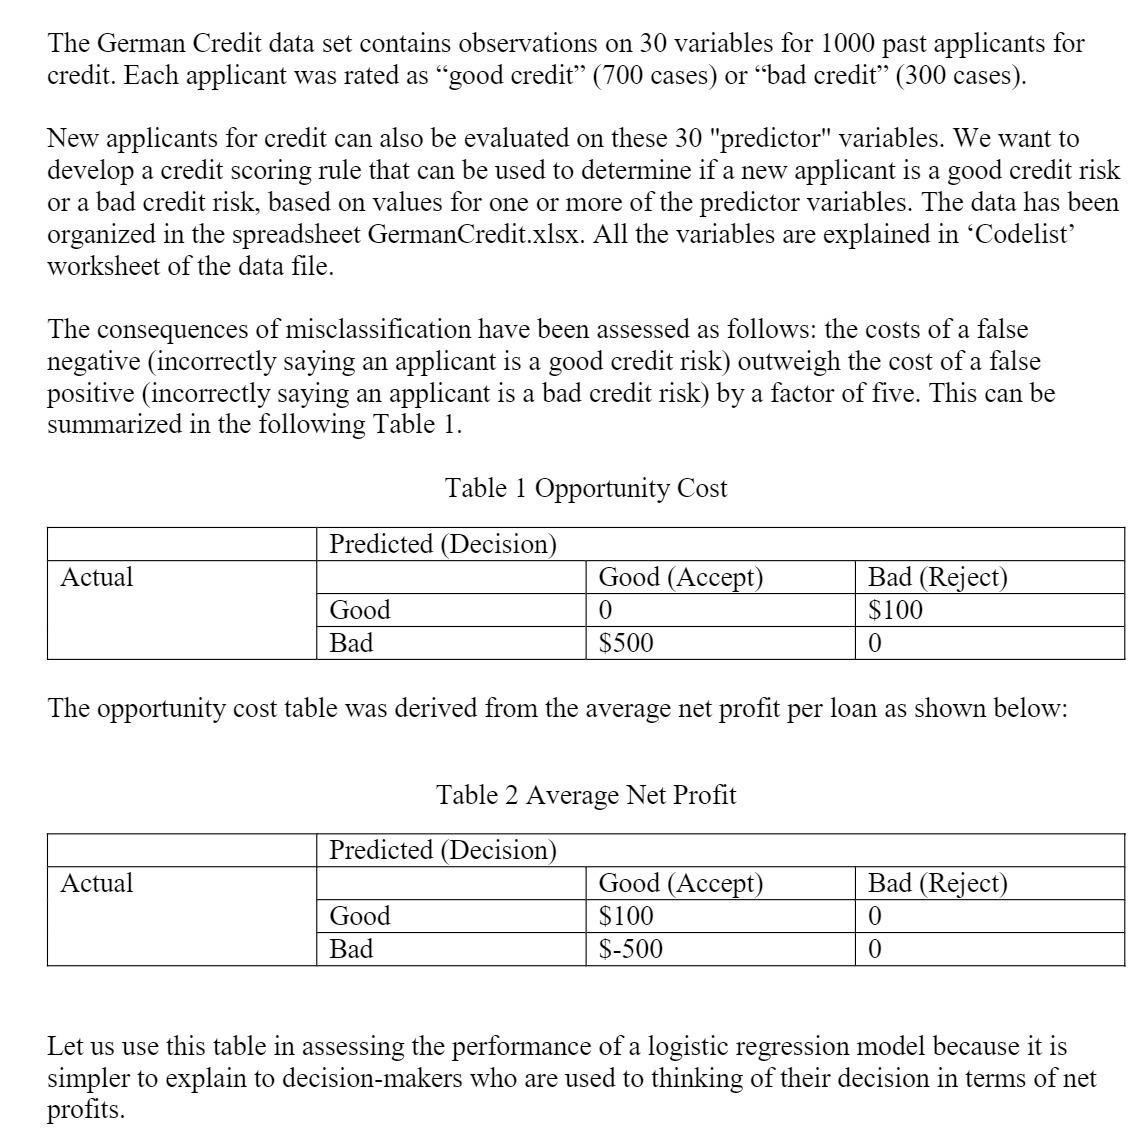
The German Credit data set contains observations on 30 variables for 1000 past applicants for credit. Each applicant was rated as "good credit" (700 cases) or "bad credit" (300 cases). New applicants for credit can also be evaluated on these 30 "predictor" variables. We want to develop a credit scoring rule that can be used to determine if a new applicant is a good credit risk or a bad credit risk, based on values for one or more of the predictor variables. The data has been organized in the spreadsheet GermanCredit.xlsx. All the variables are explained in 'Codelist' worksheet of the data file. The consequences of misclassification have been assessed as follows: the costs of a false negative (incorrectly saying an applicant is a good credit risk) outweigh the cost of a false positive (incorrectly saying an applicant is a bad credit risk) by a factor of five. This can be summarized in the following Table 1. Actual Actual Predicted (Decision) Good Bad Table 1 Opportunity Cost The opportunity cost table was derived from the average net profit per loan as shown below: Good Bad Good (Accept) 0 $500 Predicted (Decision) Table 2 Average Net Profit Bad (Reject) $100 Good (Accept) $100 $-500 Bad (Reject) 0 Let us use this table in assessing the performance of a logistic regression model because it is simpler to explain to decision-makers who are used to thinking of their decision in terms of net profits.
Step by Step Solution
3.57 Rating (161 Votes )
There are 3 Steps involved in it
To assess the performance of a logistic regression model using the opportunity cost table we need to ... View full answer

Get step-by-step solutions from verified subject matter experts