

Question: The given data represents a frequency distribution of the F-scale intensities of recent tornadoes* Tornado F- Scale | Frequency USE the frequency distribution to
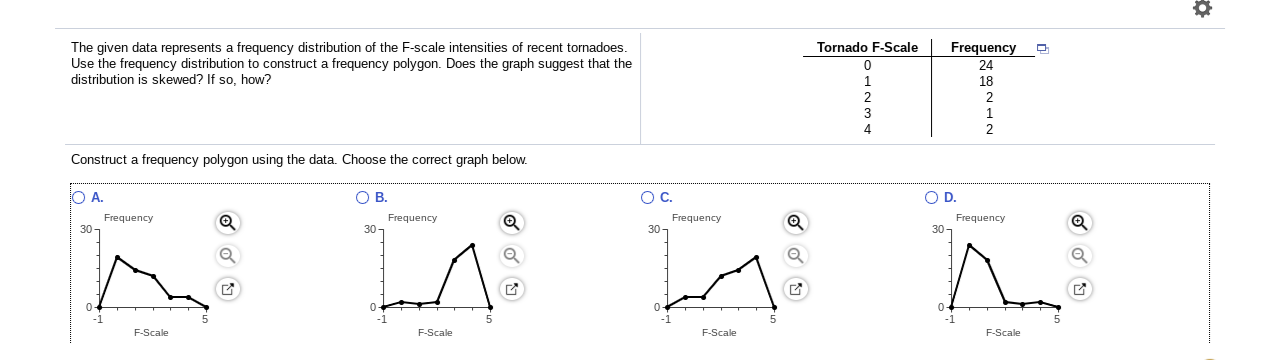
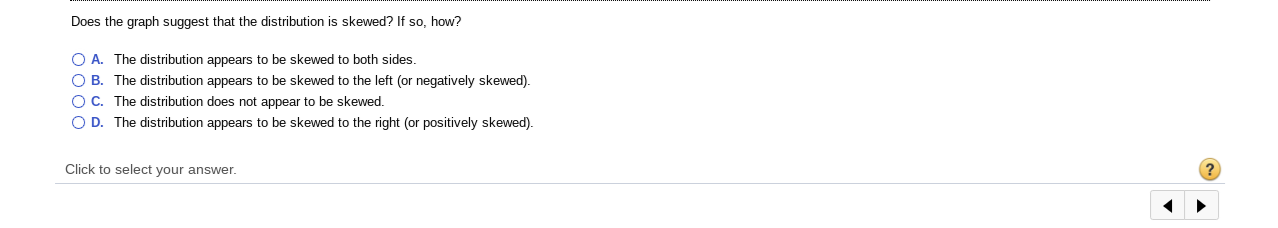
The given data represents a frequency distribution of the F-scale intensities of recent tornadoes* Tornado F- Scale \\\\ | Frequency USE the frequency distribution to construct a frequency polygon . Does the graph suggest that the 24 distribution is skewed ? If so , how ?" 18 NAN Construct a frequency polygon using the data . Choose the correct graph below* `] A . OB. FREQUENCY* FREQUENCY* FREQUENCY* Q 30) . Q FREQUENCY* Q JU - 30 - Q - 1 5 - 1 F - Scale* F - Scale* F - Scale* F - Scale*Doe: the graph suggest that the distribution is skewed? If so, how? 0 A. The distribution appears to be skewed to both sides. 0 B. The distribution appears to be skewed to the left [or negatively skewed). O C. The distribution doa not appear to be skewed, O D. The drstnbutron appears to be skewed to the right (or positively skewed}. Click to select your
Step by Step Solution
There are 3 Steps involved in it

Get step-by-step solutions from verified subject matter experts