

Question: The given data represents a frequency distribution of the F-scale intensities of Tornado F-Scale Frequency Q recent tornadoes. Use the frequency distribution to construct a

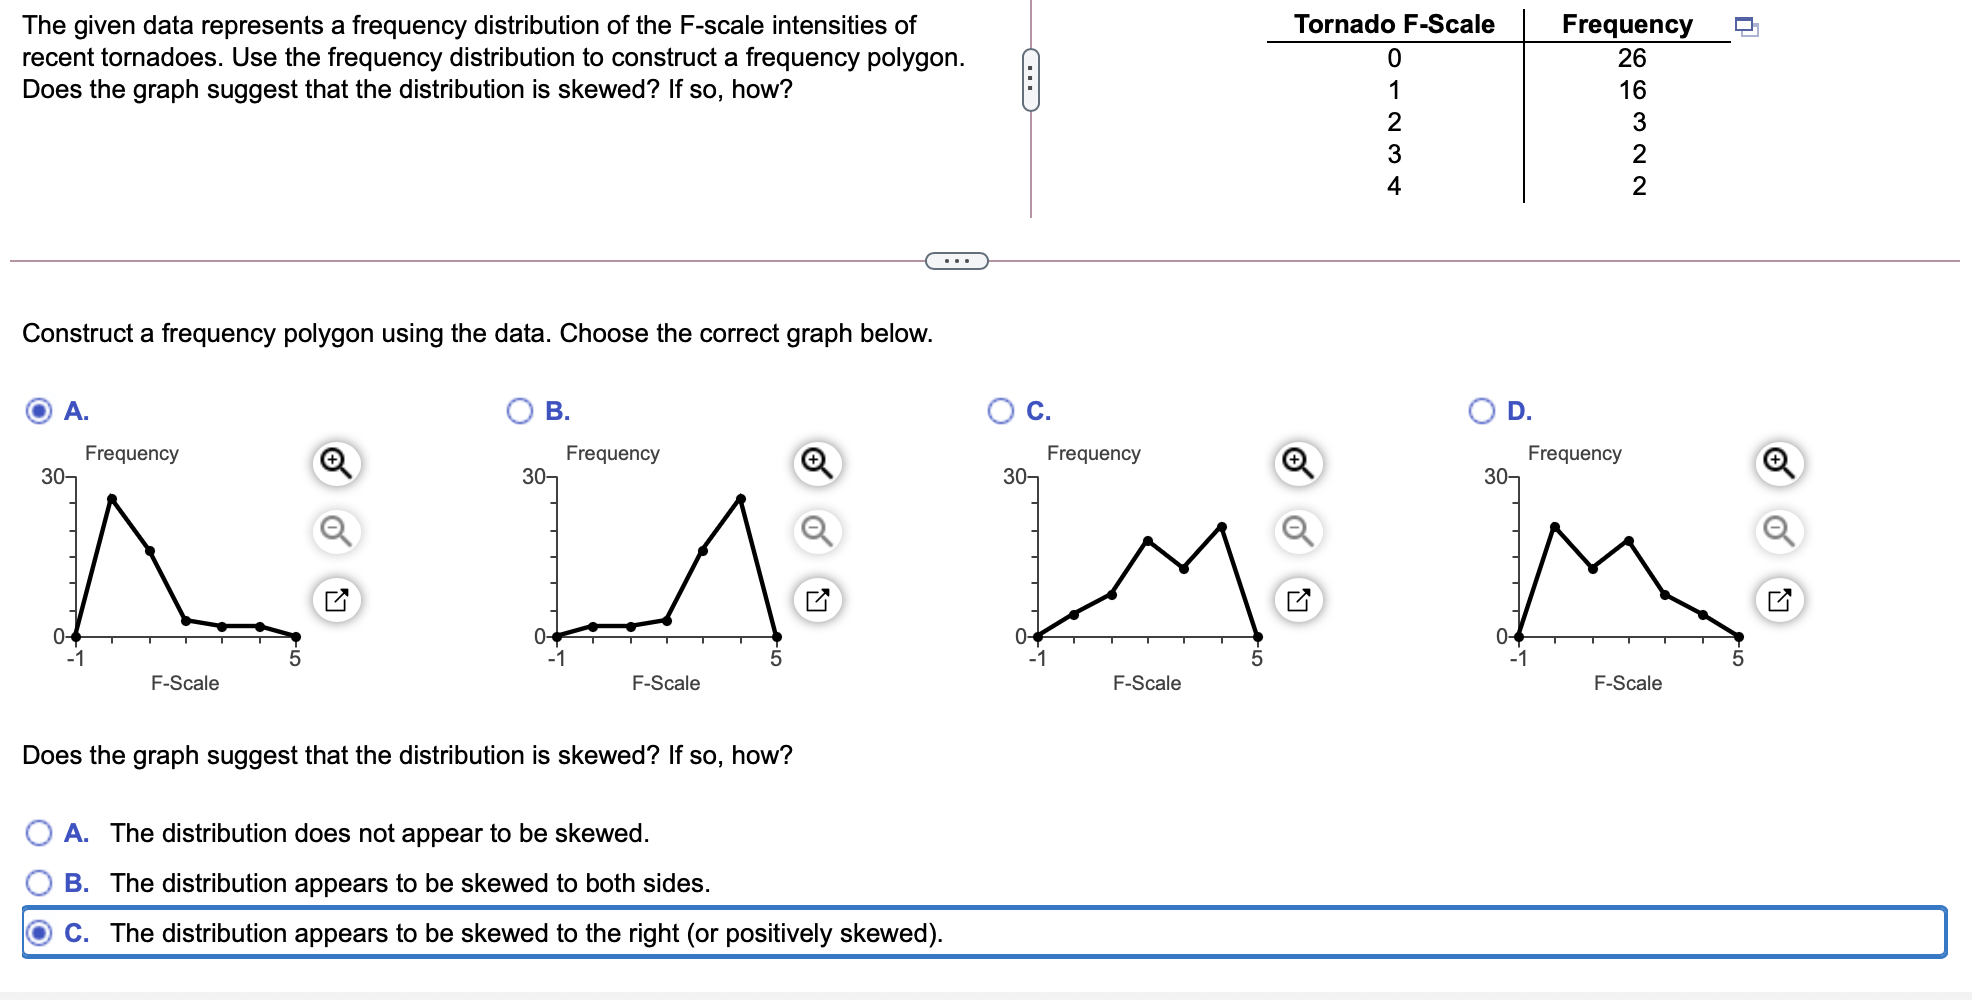
The given data represents a frequency distribution of the F-scale intensities of Tornado F-Scale Frequency Q recent tornadoes. Use the frequency distribution to construct a frequency polygon. 0 26 Does the graph suggest that the distribution is skewed? If so, how? 1 16 2 3 3 2 4 2 Construct a frequency polygon using the data. Choose the correct graph below. A. O B. O c. O D. F F uenc Frequency Frequency 30 requency Q 30 m y Q 30 Q 30 Q I3 I3 I1.\" I3\" 0 o o o -1 5 -1 5 -1 -1 F-Scale FScale F-Scale F-Scale Does the graph suggest that the distribution is skewed? If so, how? 0 A. The distribution does not appear to be skewed. O B. The distribution appears to be skewed to both sides. C. The distribution appears to be skewed to the right (or positively skewed)
Step by Step Solution
There are 3 Steps involved in it

Get step-by-step solutions from verified subject matter experts