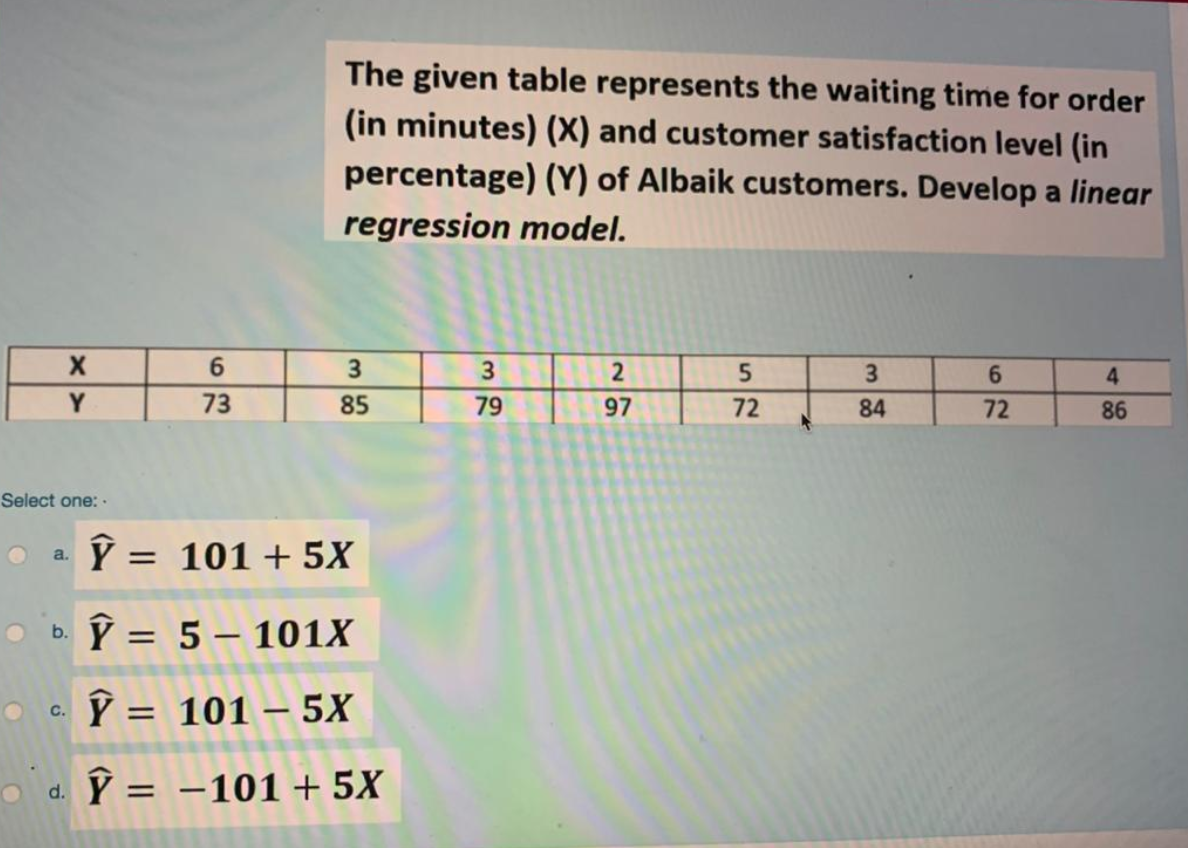
Question: The given table represents the waiting time for order (in minutes) (x) and customer satisfaction level (in percentage) (Y) of Albaik customers. Develop a linear

The given table represents the waiting time for

The given table represents the waiting time for order (in minutes) (x) and customer satisfaction level (in percentage) (Y) of Albaik customers. Develop a linear regression model. 6 3 3 85 3 79 2 97 Y 73 Nun 4 86 84 72 Select one: a. = 101 + 5X b. = 5 101x C. = 101 5X od = 101 + 5X

Step by Step Solution

There are 3 Steps involved in it

1 Expert Approved Answer
Step: 1 Unlock blur-text-image
Question Has Been Solved by an Expert!

Get step-by-step solutions from verified subject matter experts

Step: 2 Unlock
Step: 3 Unlock

Students Have Also Explored These Related General Management Questions!