

Question: The goal is to come up with a predictive model for the prices of cars based on different features of cars. We want to understand
The goal is to come up with a predictive model for the prices of cars based on different features of cars. We want to understand the factors on which the pricing of cars depends i.e. what factors affect the pricing of cars. The dataset can be downloaded from:
https://www.kaggle.com/goyalshalini93/car-data
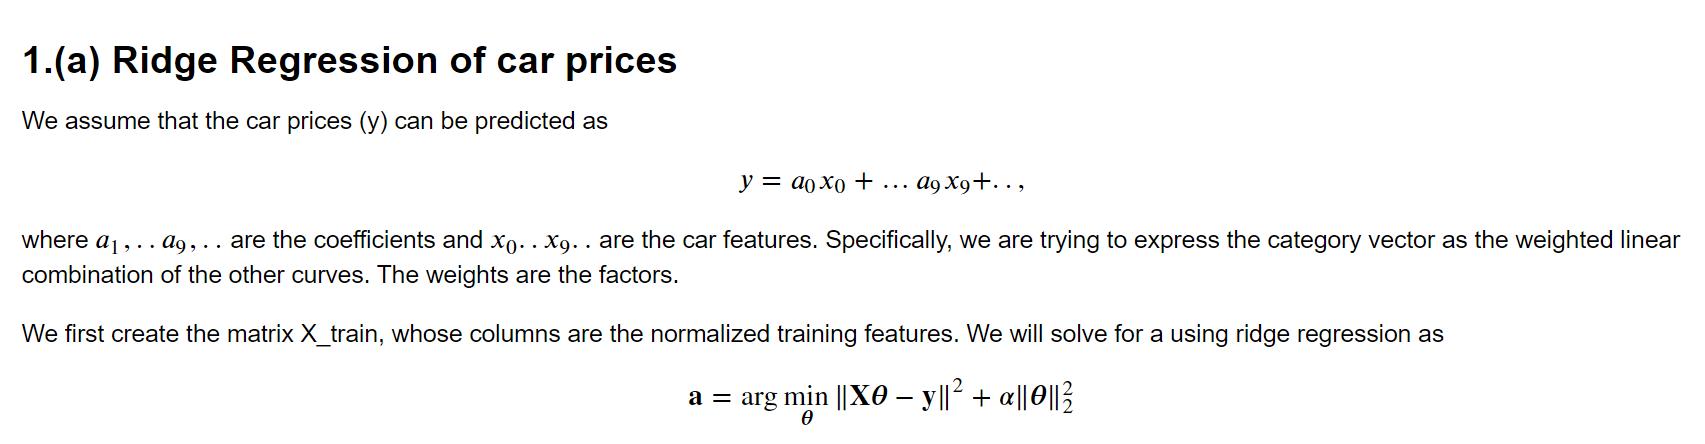
Data consists of both Categorical and Numerical Entries. We will only use the numerical entries for prediction for simplicity. You may (in the future) convert the categorical entries to numerical ones to improve prediction accuracy. The columns are the features of the car, including its price. You will regress the car price from the other features.
Several features of the cars are given in the attached spreadsheet. You will use the numerical features to make the prediction. The goal is to obtain good predictions using a minimum number of predictors, which will improve interpretability.
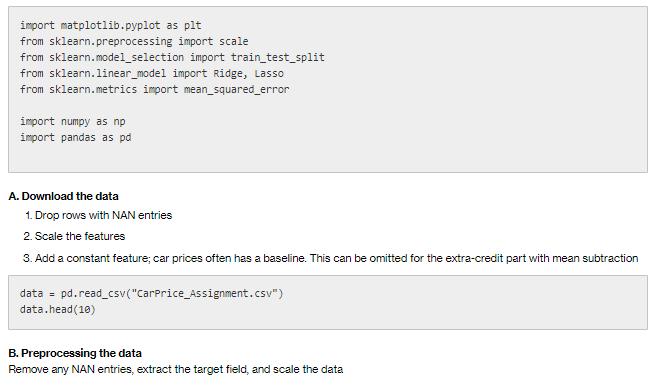
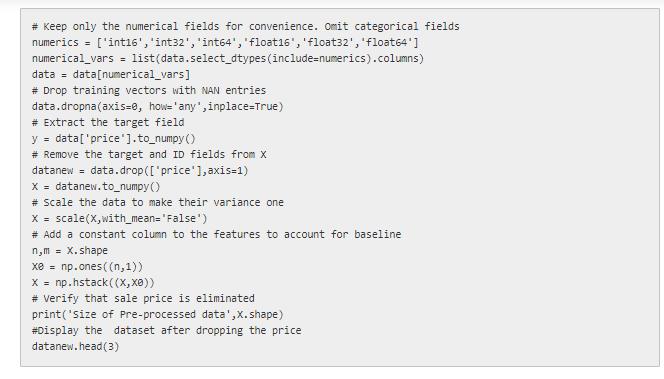
import matplotlib.pyplot as plt from sklearn.preprocessing import scale from sklearn.model_selection from sklearn.linear_model import Ridge, Lasso from sklearn.metrics import mean_squared_error import numpy as np import pandas as pd A. Download the data import train_test_split 1. Drop rows with NAN entries 2. Scale the features 3. Add a constant feature; car prices often has a baseline. This can be omitted for the extra-credit part with mean subtraction data = pd.read_csv ("CarPrice_Assignment.csv") data.head(10) B. Preprocessing the data Remove any NAN entries, extract the target field, and scale the data
Step by Step Solution
3.50 Rating (157 Votes )
There are 3 Steps involved in it
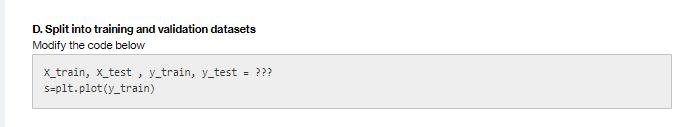
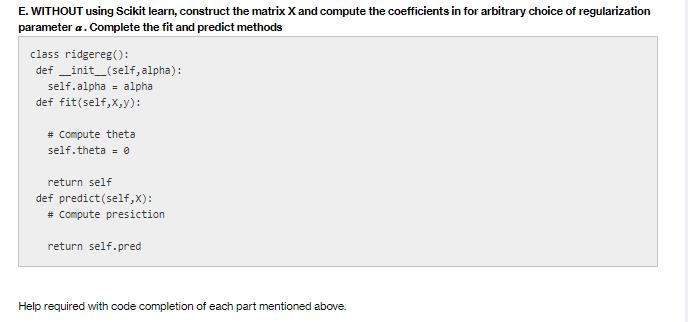
Here is the required python code you need to fill in xtrain xtest ytrain ytest traintestsplitX y testsize02 randomstate42 spltplotytrain class RidgeRe... View full answer

Get step-by-step solutions from verified subject matter experts