

Question: The graph above shows the break - even analysis for the cost of making a certain good. Based on this chart, which of the following
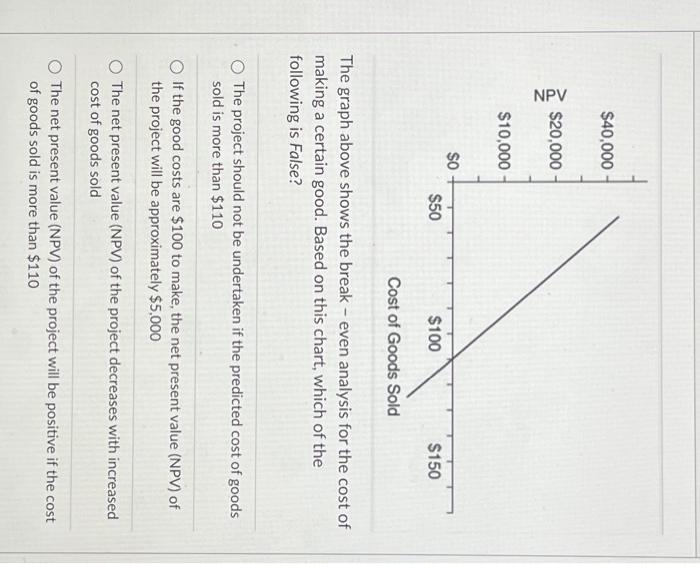
The graph above shows the break - even analysis for the cost of making a certain good. Based on this chart, which of the following is False? The project should not be undertaken if the predicted cost of goods sold is more than $110 If the good costs are $100 to make, the net present value (NPV) of the project will be approximately $5,000 The net present value (NPV) of the project decreases with increased cost of goods sold The net present value (NPV) of the project will be positive if the cost of goods sold is more than $110
Step by Step Solution
There are 3 Steps involved in it
1 Expert Approved Answer
Step: 1 Unlock

Question Has Been Solved by an Expert!
Get step-by-step solutions from verified subject matter experts
Step: 2 Unlock
Step: 3 Unlock