

Question: The graph below depicts a function m). Its two asymptotes are indicated in red: The graph below depicts a function 9(a) . Its one asymptote
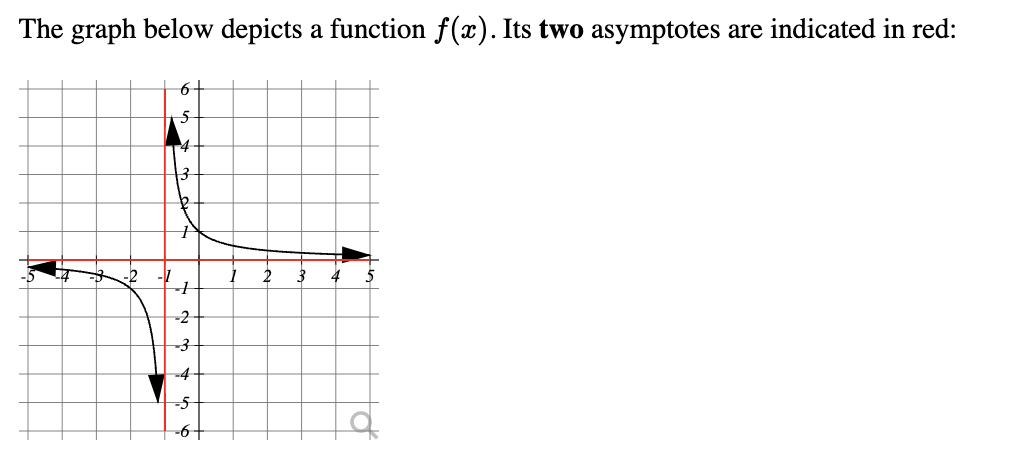


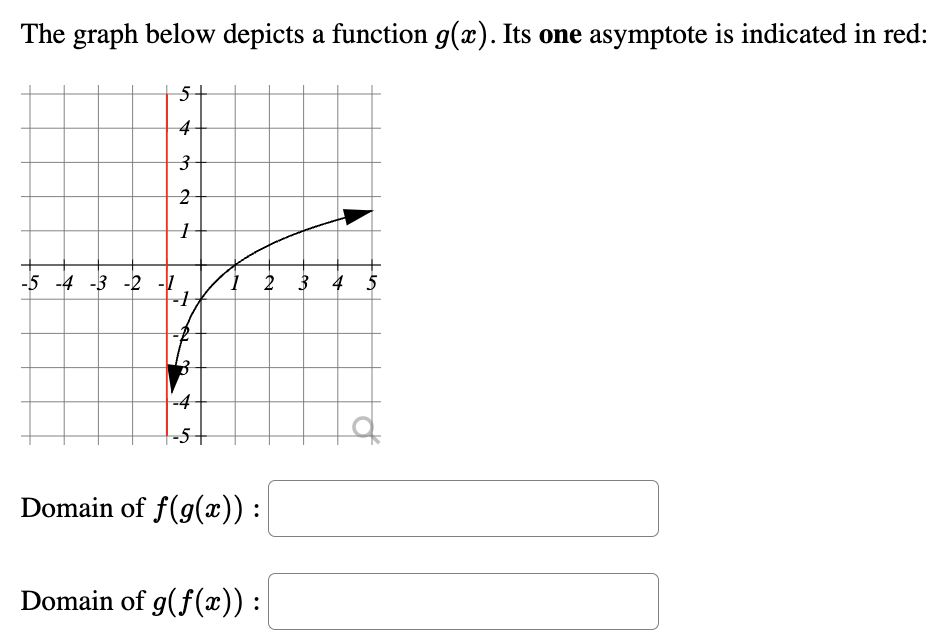
The graph below depicts a function m). Its two asymptotes are indicated in red: The graph below depicts a function 9(a) . Its one asymptote is indicated in red: 5 4 3 2 1 :5-4-3-2- 1.' 2 3 45 _4 . _ 5 . .1 Domain of f(g(a:)) : ' Domain of g(f(m))
Step by Step Solution
There are 3 Steps involved in it
1 Expert Approved Answer
Step: 1 Unlock

Question Has Been Solved by an Expert!
Get step-by-step solutions from verified subject matter experts
Step: 2 Unlock
Step: 3 Unlock