

The graph below depicts the wholesale market for corn. A new govenment regulation is put in plave
Question:
The graph below depicts the wholesale market for corn. A new govenment regulation is put in plave that requires gasoline producers to include more ethanol when producing unleaded gasoline.
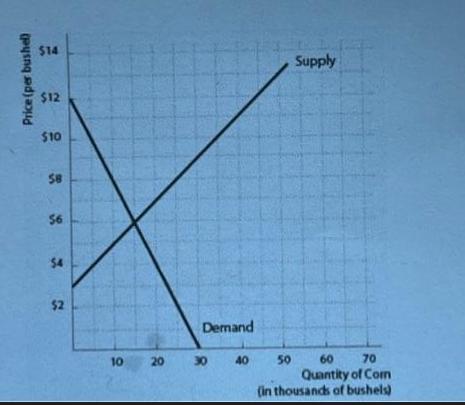
1. The new regulation will shift either the demand or the supply curve by 15,000 bushels at every price?
2. Tell whether the equilibrium price of a bushel of corn rises or falls? What would be the new equilibrium price?
3. Tell whether the equilbrium quantity of corn increases or decreases? What is the new equilibrium quantity?
Create a graph showing the correct demand or supply shift, the new equilibrium price and the new equilibrium quantity after the introduction of the new government regulation.
Expert Answer:


Microeconomics
ISBN: 9781464146978
1st Edition
Authors: Austan Goolsbee, Steven Levitt, Chad Syverson
