

Question: The graph below illustrates the relationship between output per worker and capital per worker, which is derived from the aggregate production function in the Solow

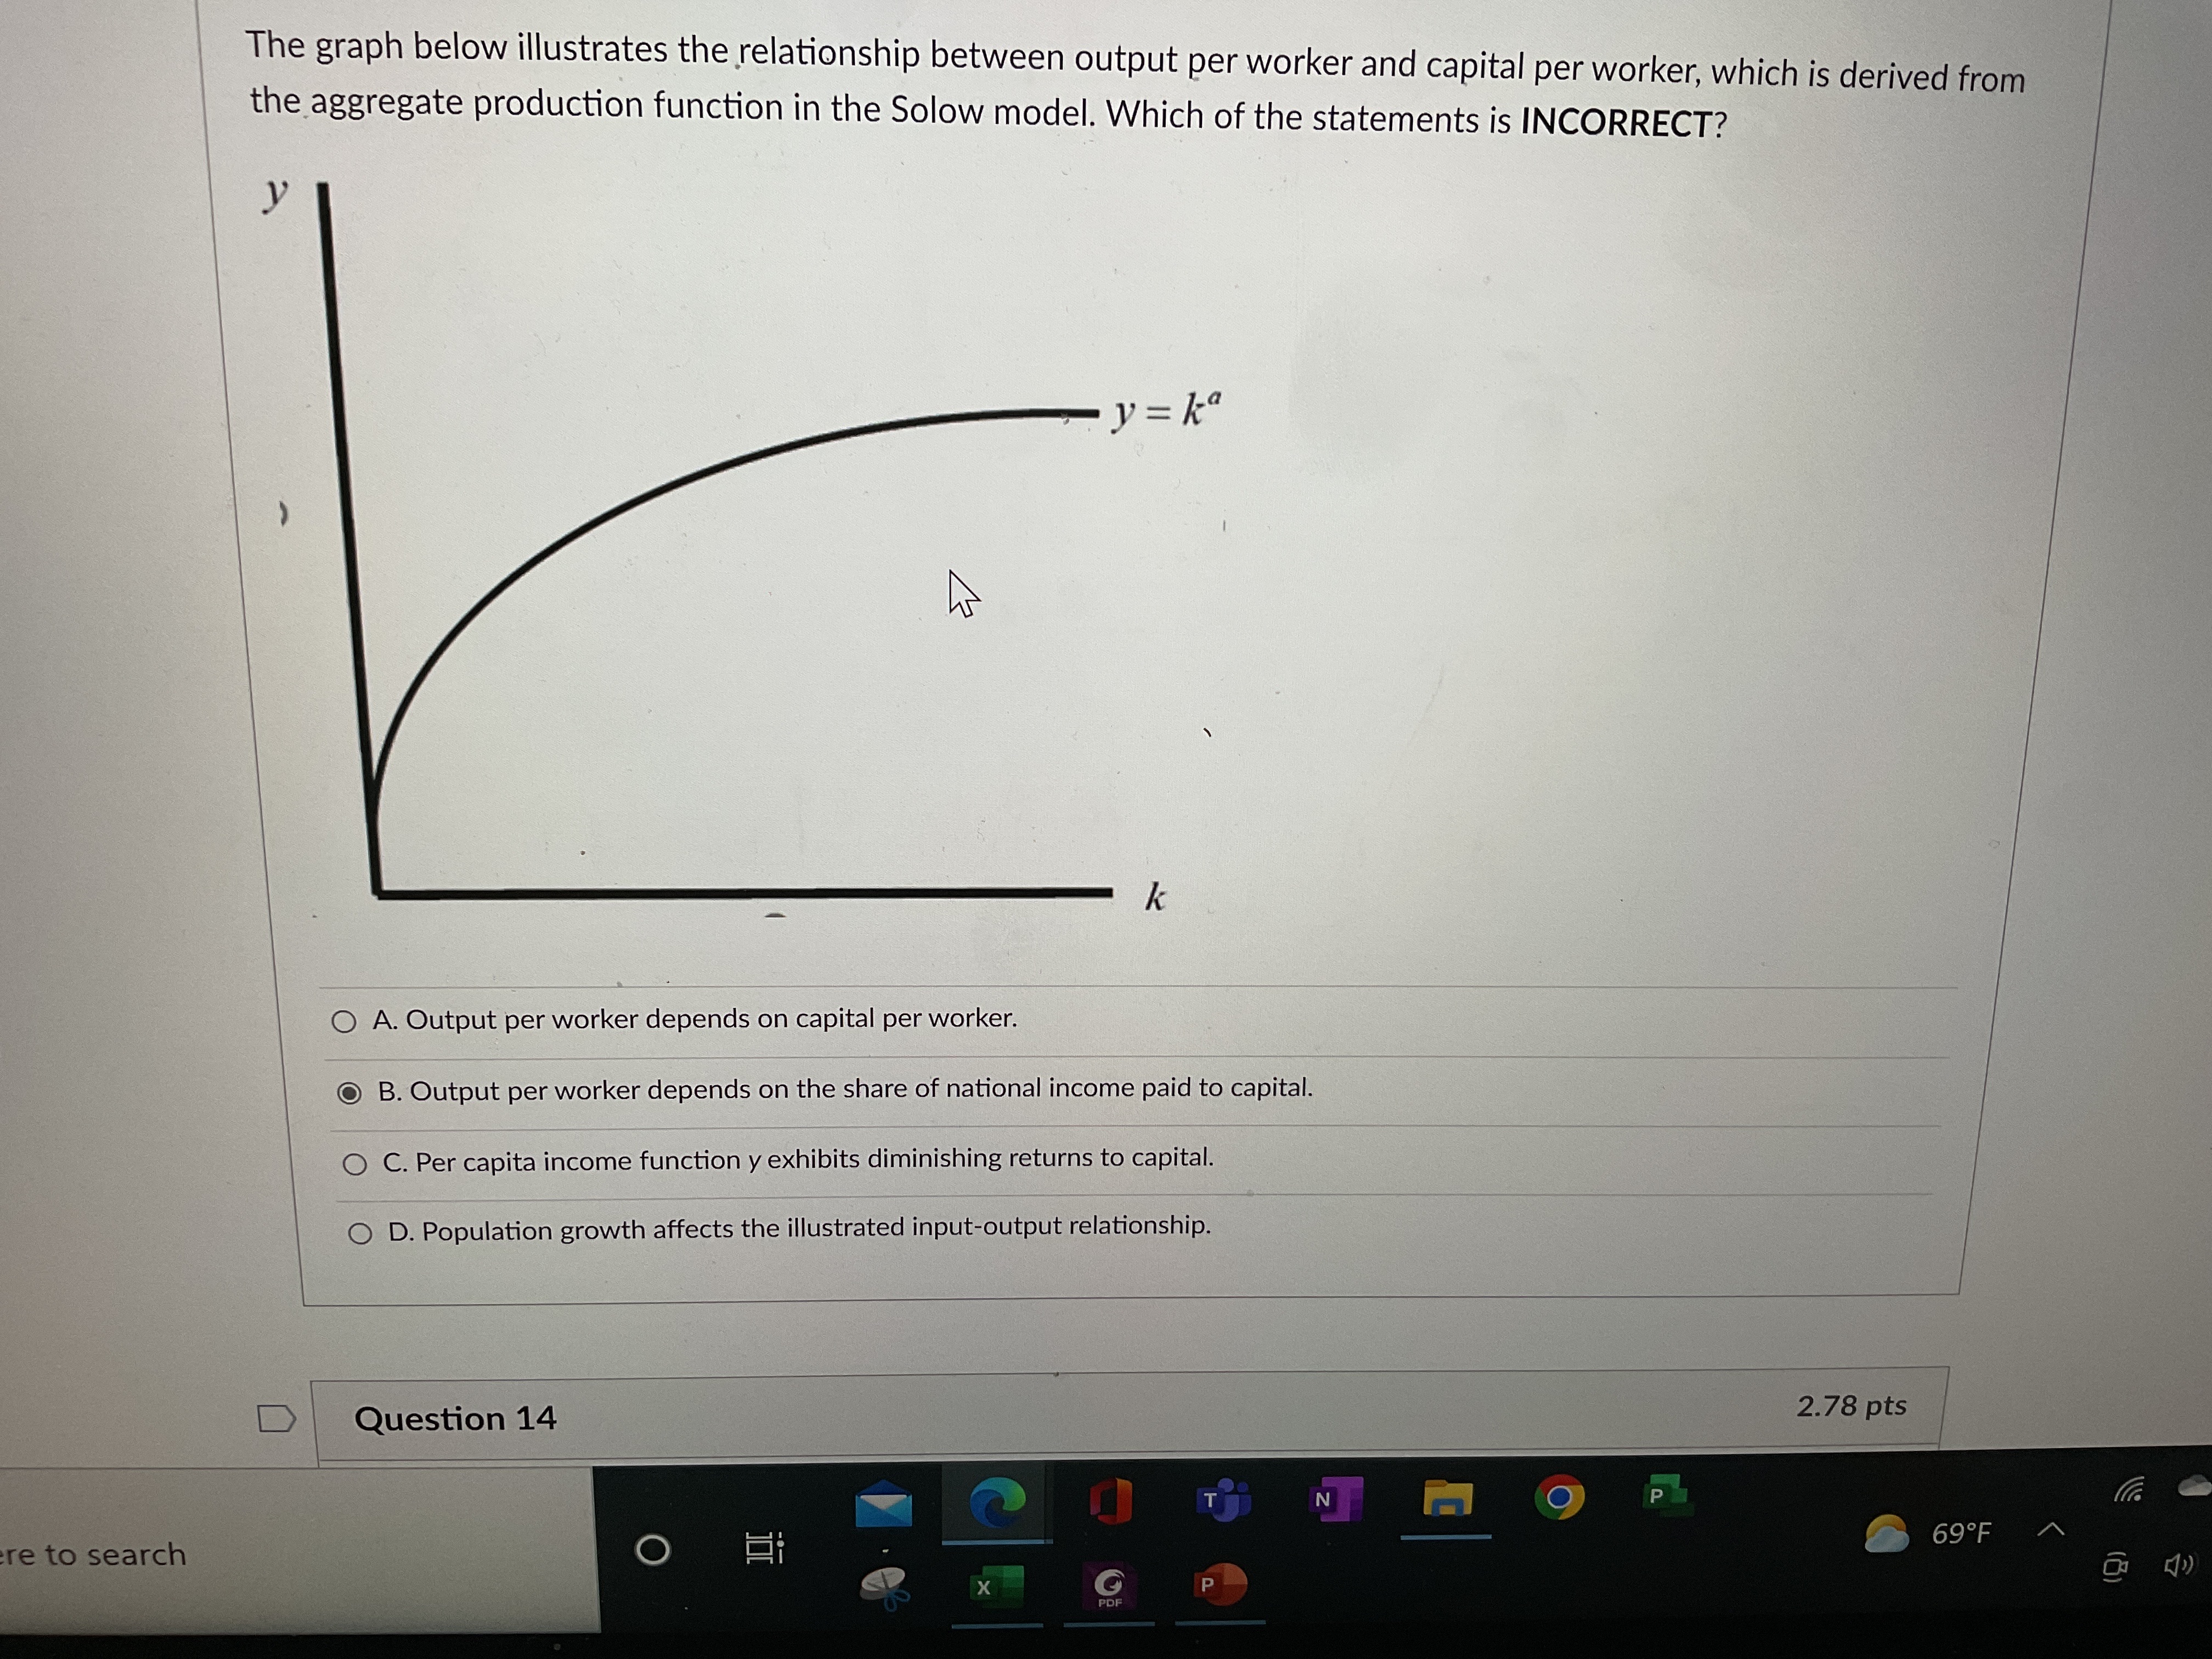
The graph below illustrates the relationship between output per worker and capital per worker, which is derived from the aggregate production function in the Solow model. Which of the statements is INCORRECT? y y = ka k O A. Output per worker depends on capital per worker. B. Output per worker depends on the share of national income paid to capital. O C. Per capita income function y exhibits diminishing returns to capital. O D. Population growth affects the illustrated input-output relationship. D Question 14 2.78 pts N O P re to search O Fi 69.F P
Step by Step Solution
There are 3 Steps involved in it
1 Expert Approved Answer
Step: 1 Unlock

Question Has Been Solved by an Expert!
Get step-by-step solutions from verified subject matter experts
Step: 2 Unlock
Step: 3 Unlock