

Question: The graph below is considered to be misleading. Pick the reason(s) why. Select all that apply. BIGGEST COVID-19 WORRIES GETTING IT 62% FAMILY GETTING IT
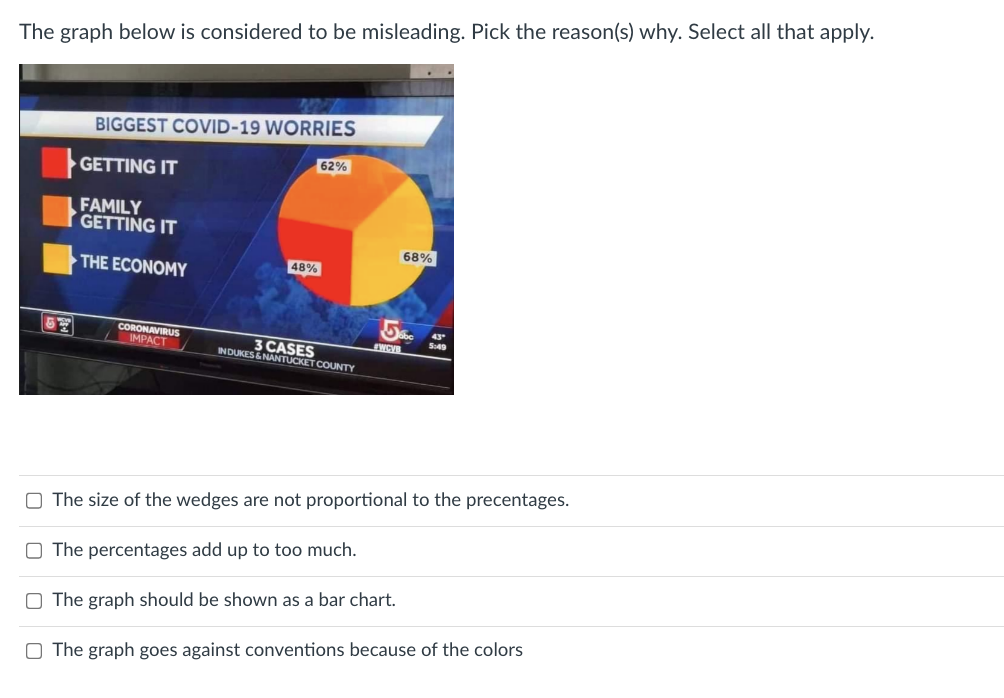
The graph below is considered to be misleading. Pick the reason(s) why. Select all that apply. BIGGEST COVID-19 WORRIES GETTING IT 62% FAMILY GETTING IT 68% THE ECONOMY 48% CORONAVIRUS 5:49 IMPACT 3 CASES IN DUKES & NANTUCKET COUNTY O The size of the wedges are not proportional to the precentages. O The percentages add up to too much. O The graph should be shown as a bar chart. O The graph goes against conventions because of the colors
Step by Step Solution
There are 3 Steps involved in it
1 Expert Approved Answer
Step: 1 Unlock

Question Has Been Solved by an Expert!
Get step-by-step solutions from verified subject matter experts
Step: 2 Unlock
Step: 3 Unlock