

Question: What are your biggest 6. What makes the data display misleading? COVID-19 worries? 68% A. The bars are different sizes 62% B. You can't use

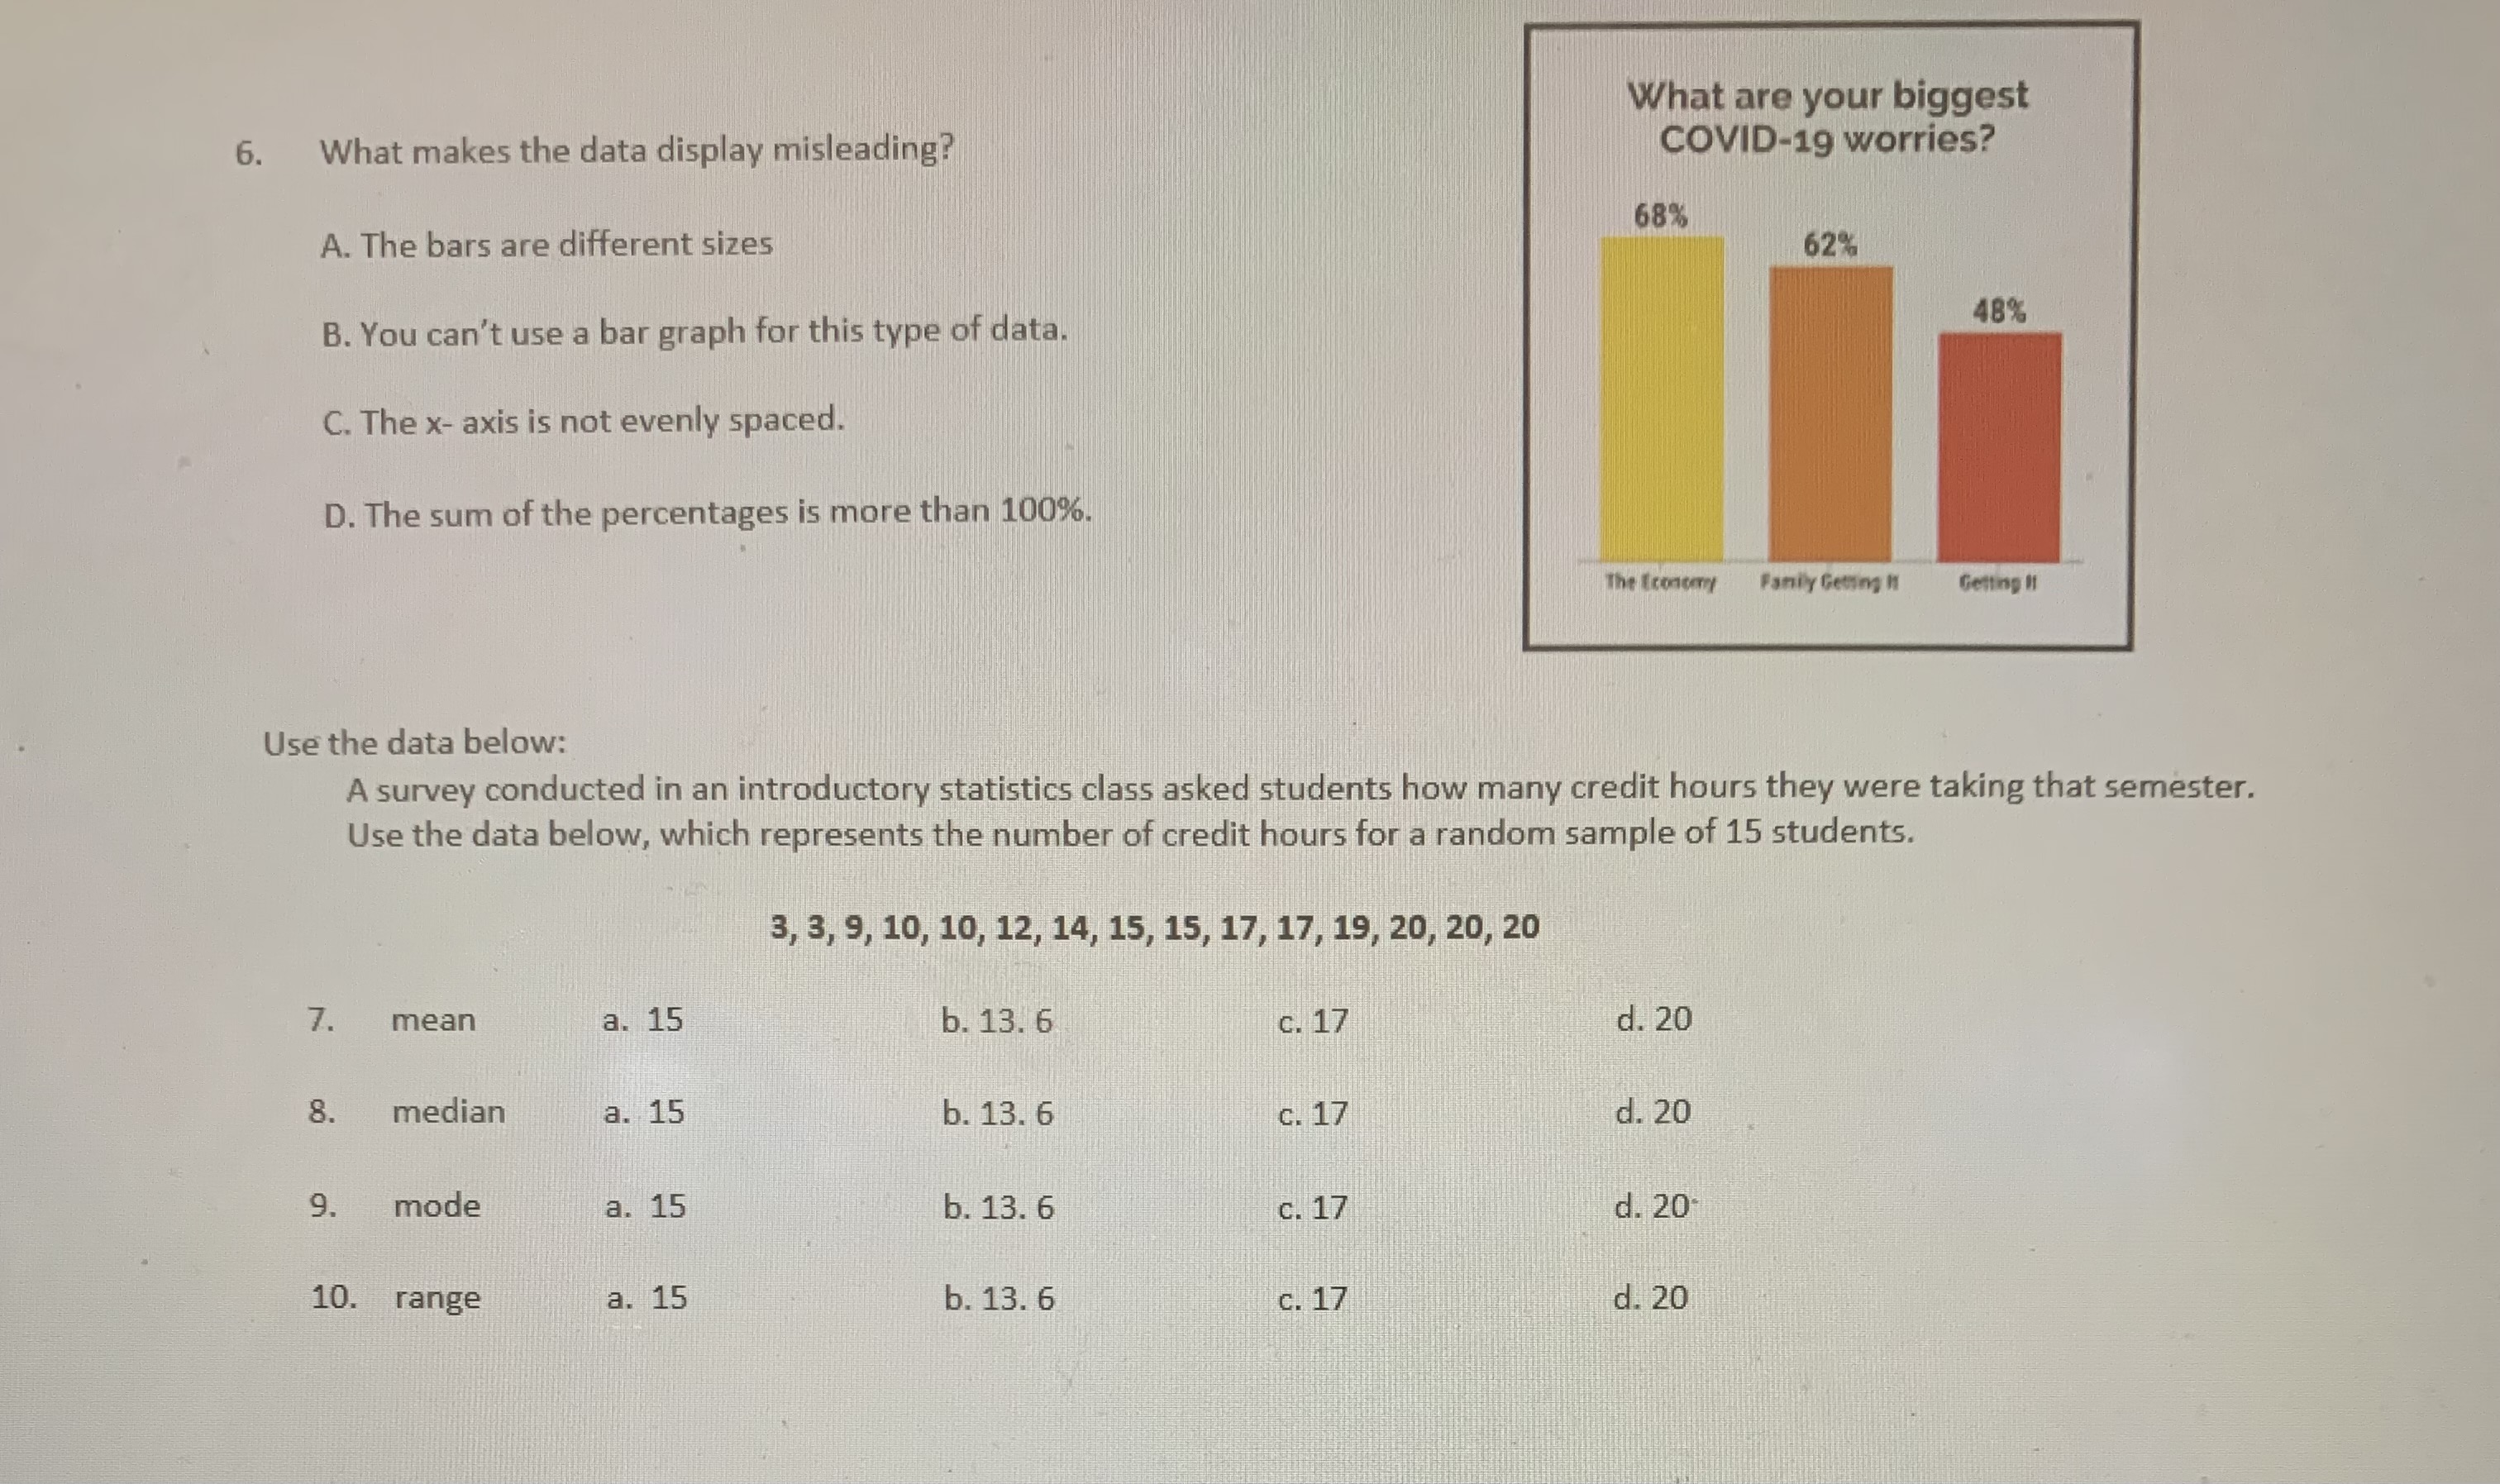
What are your biggest 6. What makes the data display misleading? COVID-19 worries? 68% A. The bars are different sizes 62% B. You can't use a bar graph for this type of data. 48% C. The x- axis is not evenly spaced. D. The sum of the percentages is more than 100%. The Economy Family Getting It Getting !1 Use the data below: A survey conducted in an introductory statistics class asked students how many credit hours they were taking that semester. Use the data below, which represents the number of credit hours for a random sample of 15 students. 3, 3, 9, 10, 10, 12, 14, 15, 15, 17, 17, 19, 20, 20, 20 7. mean a. 15 b. 13. 6 c. 17 d. 20 8. median a. 15 b. 13. 6 c. 17 d. 20 9. mode a. 15 b. 13. 6 c. 17 d. 20 10. range a. 15 b. 13. 6 c. 17 d. 20
Step by Step Solution
There are 3 Steps involved in it

Get step-by-step solutions from verified subject matter experts