

Question: The graph below is from: Mak, L. et al, Serum Mac-2 binding protein glycosylation isomer level predicts hepatocellular carcinoma development in E-negative chronic hepatitis B
The graph below is from:
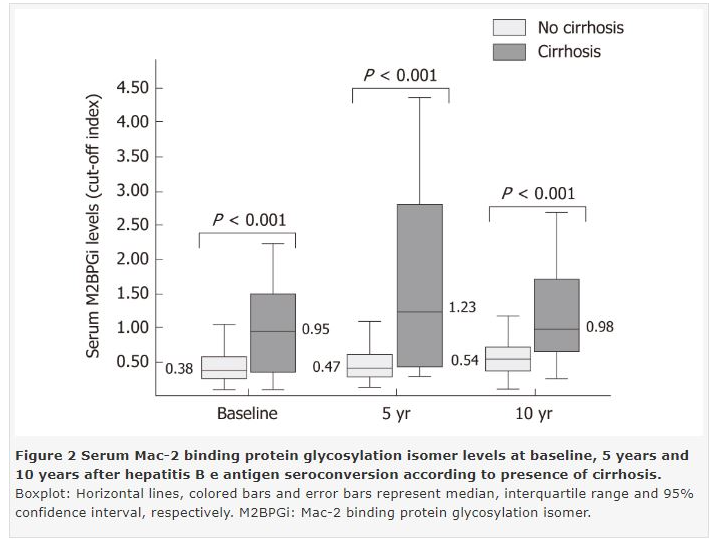
- Mak, L. et al, Serum Mac-2 binding protein glycosylation isomer level predicts hepatocellular carcinoma development in E-negative chronic hepatitis B patients, World J Gastroenterol. Mar 21, 2019; 25(11): 1398-1408.http://dx.doi.org/10.3748/wjg.v25.i11.1398
This study involved assessing the use of a biomarker(Serum M2BPGi) to measure severity of liver disease among a retrospective sample of 207 patients with chronic hepatitis B. At 10 years, 16.9% of the patients had developed cirrhosis.The graph below compares the distribution of biomarkerlevels between patients with or without cirrhosis at three timepoints.
Which hypothesis test would be appropriate to compare the groups (Cirrhosis and No cirrhosis) at each timepoint?
- Wilcoxonsigned rank test
- Test of two proportions (aka. prtestiin Stata)
- Paired t-test
- Wilcoxon rank-sum test (aka. Mann-Whitney)
No cirrhosis Cirrhosis P
Step by Step Solution
There are 3 Steps involved in it
1 Expert Approved Answer
Step: 1 Unlock

Question Has Been Solved by an Expert!
Get step-by-step solutions from verified subject matter experts
Step: 2 Unlock
Step: 3 Unlock