

Question: The graph below plots out the current account and goods and services balance (trade account) for Canada from the early 1960s to 2017. Percentage
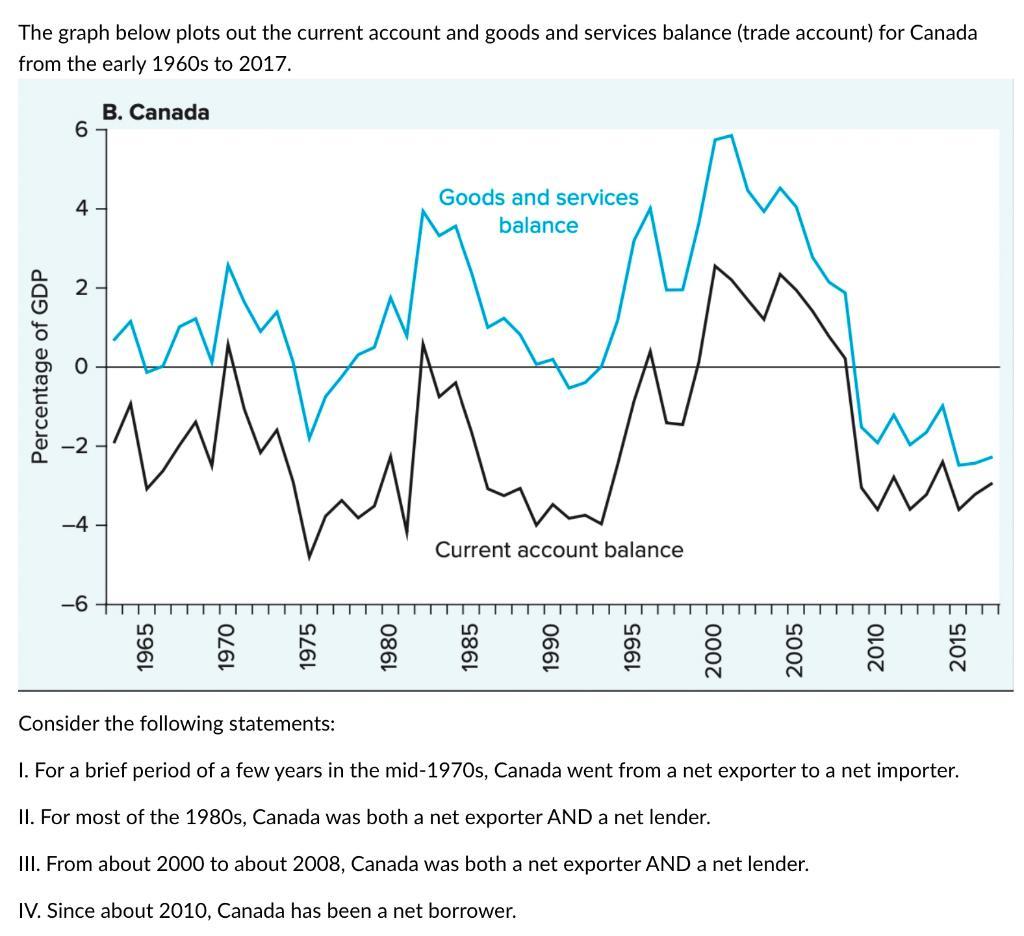
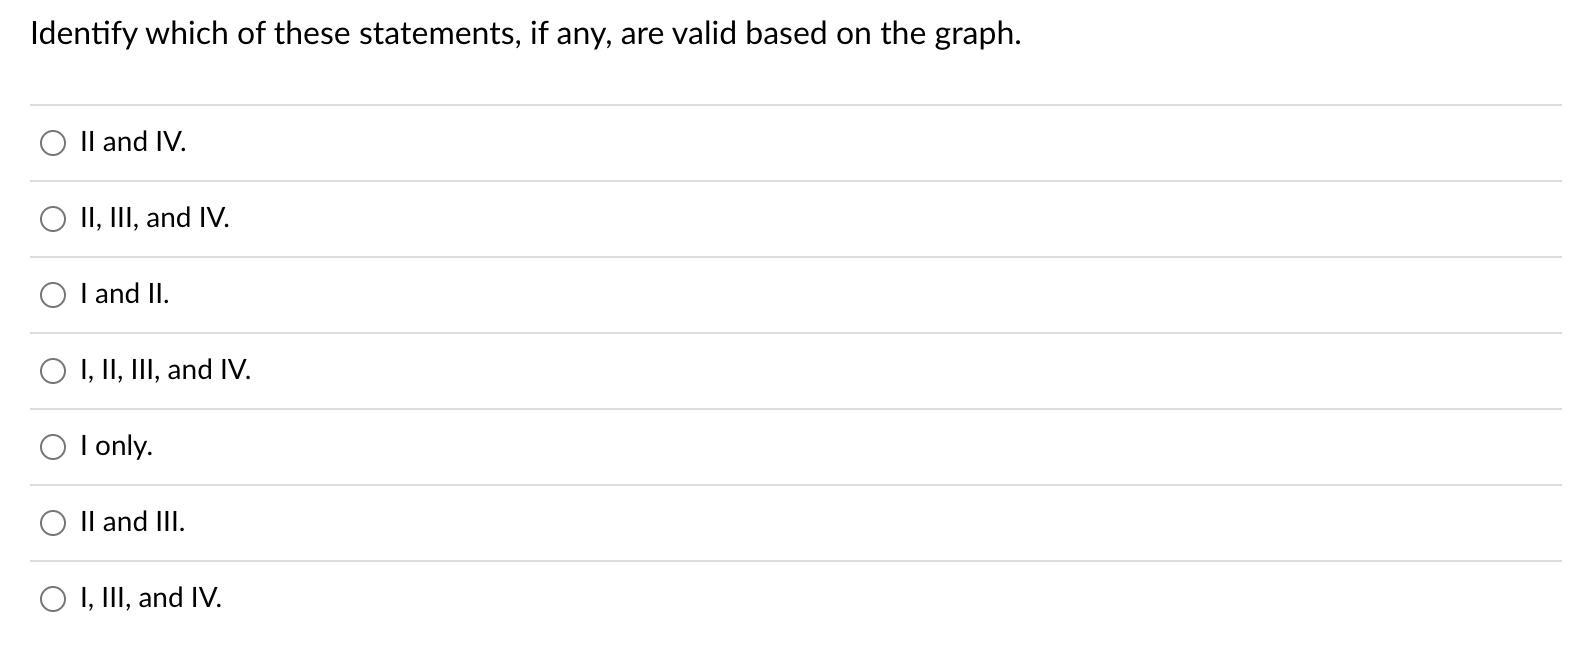
The graph below plots out the current account and goods and services balance (trade account) for Canada from the early 1960s to 2017. Percentage of GDP 6- 4 2 ~ B. Canada -4 Goods and services balance Current account balance 2015 Consider the following statements: 1. For a brief period of a few years in the mid-1970s, Canada went from a net exporter to a net importer. II. For most of the 1980s, Canada was both a net exporter AND a net lender. III. From about 2000 to about 2008, Canada was both a net exporter AND a net lender. IV. Since about 2010, Canada has been a net borrower. Identify which of these statements, any, are valid based on the graph. II and IV. II, III, and IV. I and II. O I, II, III, and IV. I only. II and III. O I, III, and IV.
Step by Step Solution
3.37 Rating (163 Votes )
There are 3 Steps involved in it
The detailed answer for the above question is provided below ANSWER I III and IV ... View full answer

Get step-by-step solutions from verified subject matter experts