

Question: The graph below plots the current SML. From the SML, the current risk-free rate (r_RF) is while the market risk premium (RP_M) is Carson Computing's
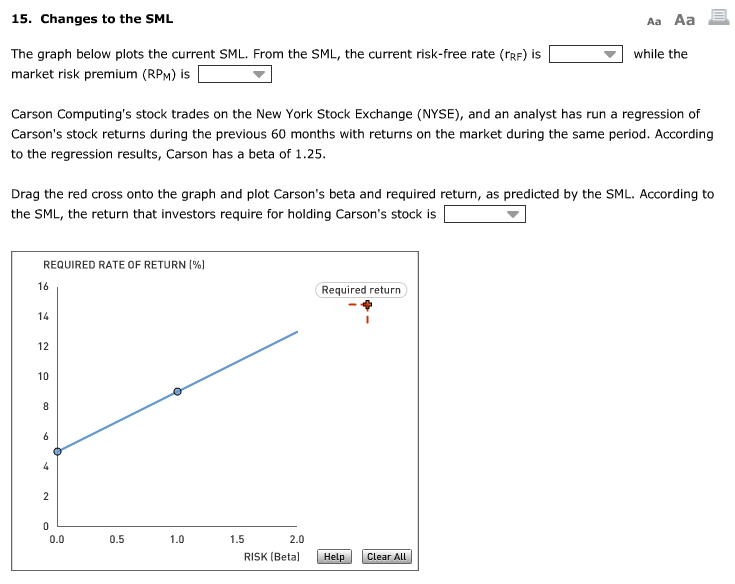
The graph below plots the current SML. From the SML, the current risk-free rate (r_RF) is while the market risk premium (RP_M) is Carson Computing's stock trades on the New York Stock Exchange (NYSE), and an analyst has run a regression of Carson's stock returns during the previous 60 months with returns on the market during the same period. According to the regression results, Carson has a beta of 1.25. Drag the red cross onto the graph and plot Carson's beta and required return, as predicted by the SML. According to the SML, the return that investors require for holding Carson's stock is The graph below plots the current SML. From the SML, the current risk-free rate (r_RF) is while the market risk premium (RP_M) is Carson Computing's stock trades on the New York Stock Exchange (NYSE), and an analyst has run a regression of Carson's stock returns during the previous 60 months with returns on the market during the same period. According to the regression results, Carson has a beta of 1.25. Drag the red cross onto the graph and plot Carson's beta and required return, as predicted by the SML. According to the SML, the return that investors require for holding Carson's stock is
Step by Step Solution
There are 3 Steps involved in it

Get step-by-step solutions from verified subject matter experts