

Question: The graph below plots velocity vs. time for an object moving along a straight path. v (m/s) 24 18 12- 6 0 -6 -12
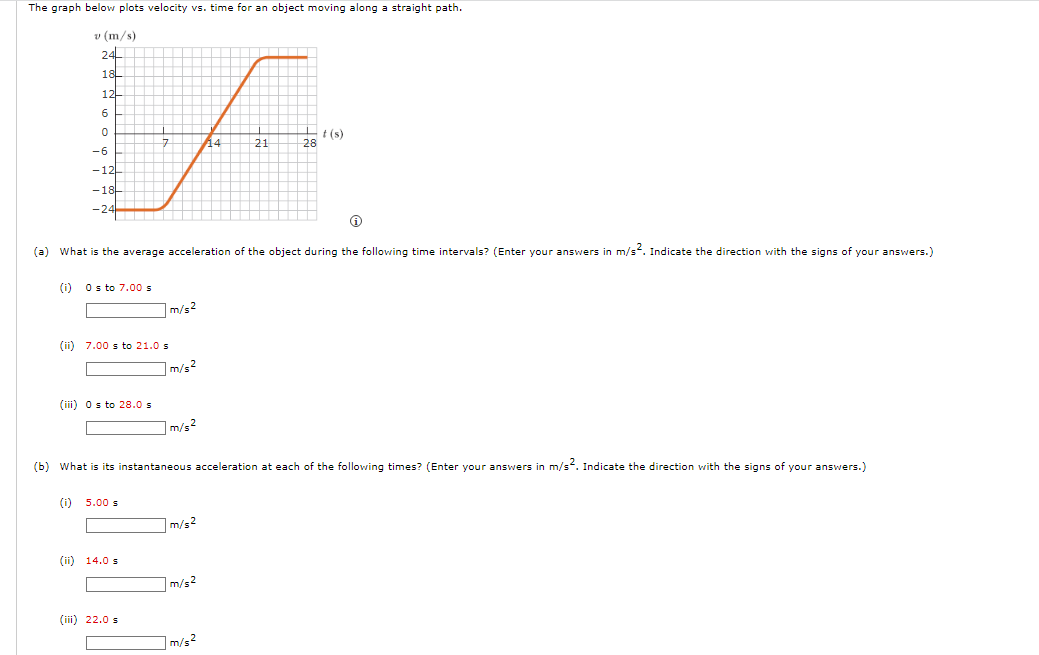
The graph below plots velocity vs. time for an object moving along a straight path. v (m/s) 24 18 12- 6 0 -6 -12 -18- -24 (i) 0s to 7.00 s (iii) 0s to 28.0 s (ii) 7.00 s to 21.0 s 7 (a) What is the average acceleration of the object during the following time intervals? (Enter your answers in m/s. Indicate the direction with the signs of your answers.) (i) 5.00 s (ii) 14.0 st m/s2 (iii) 22.0 s m/s m/s (b) What is its instantaneous acceleration at each of the following times? (Enter your answers in m/s2. Indicate the direction with the signs of your answers.) m/s2 14 m/s L 21 m/s 28 t(s)
Step by Step Solution
3.44 Rating (151 Votes )
There are 3 Steps involved in it
The image youve provided shows a graph of an objects velocity in meters per second over time in seconds With this information we can calculate the ave... View full answer

Get step-by-step solutions from verified subject matter experts