

Question: The graph below represents a relationship between y and x . The point (0,3.2) satisfies this relationship. Also, notice that a constant rate of change
The graph below represents a relationship between
yand
x. The point
(0,3.2)satisfies this relationship. Also, notice that a constant rate of change exists between these quantities, namely the constant rate of change of
ywith respect to
xis -4.3 .\ a. What is the value of
ywhen
x=2.1?\ b. What is the value of
ywhen
x=-3.8?\ c. Write a formula that gives the value of
yin terms of the varying values of
x.
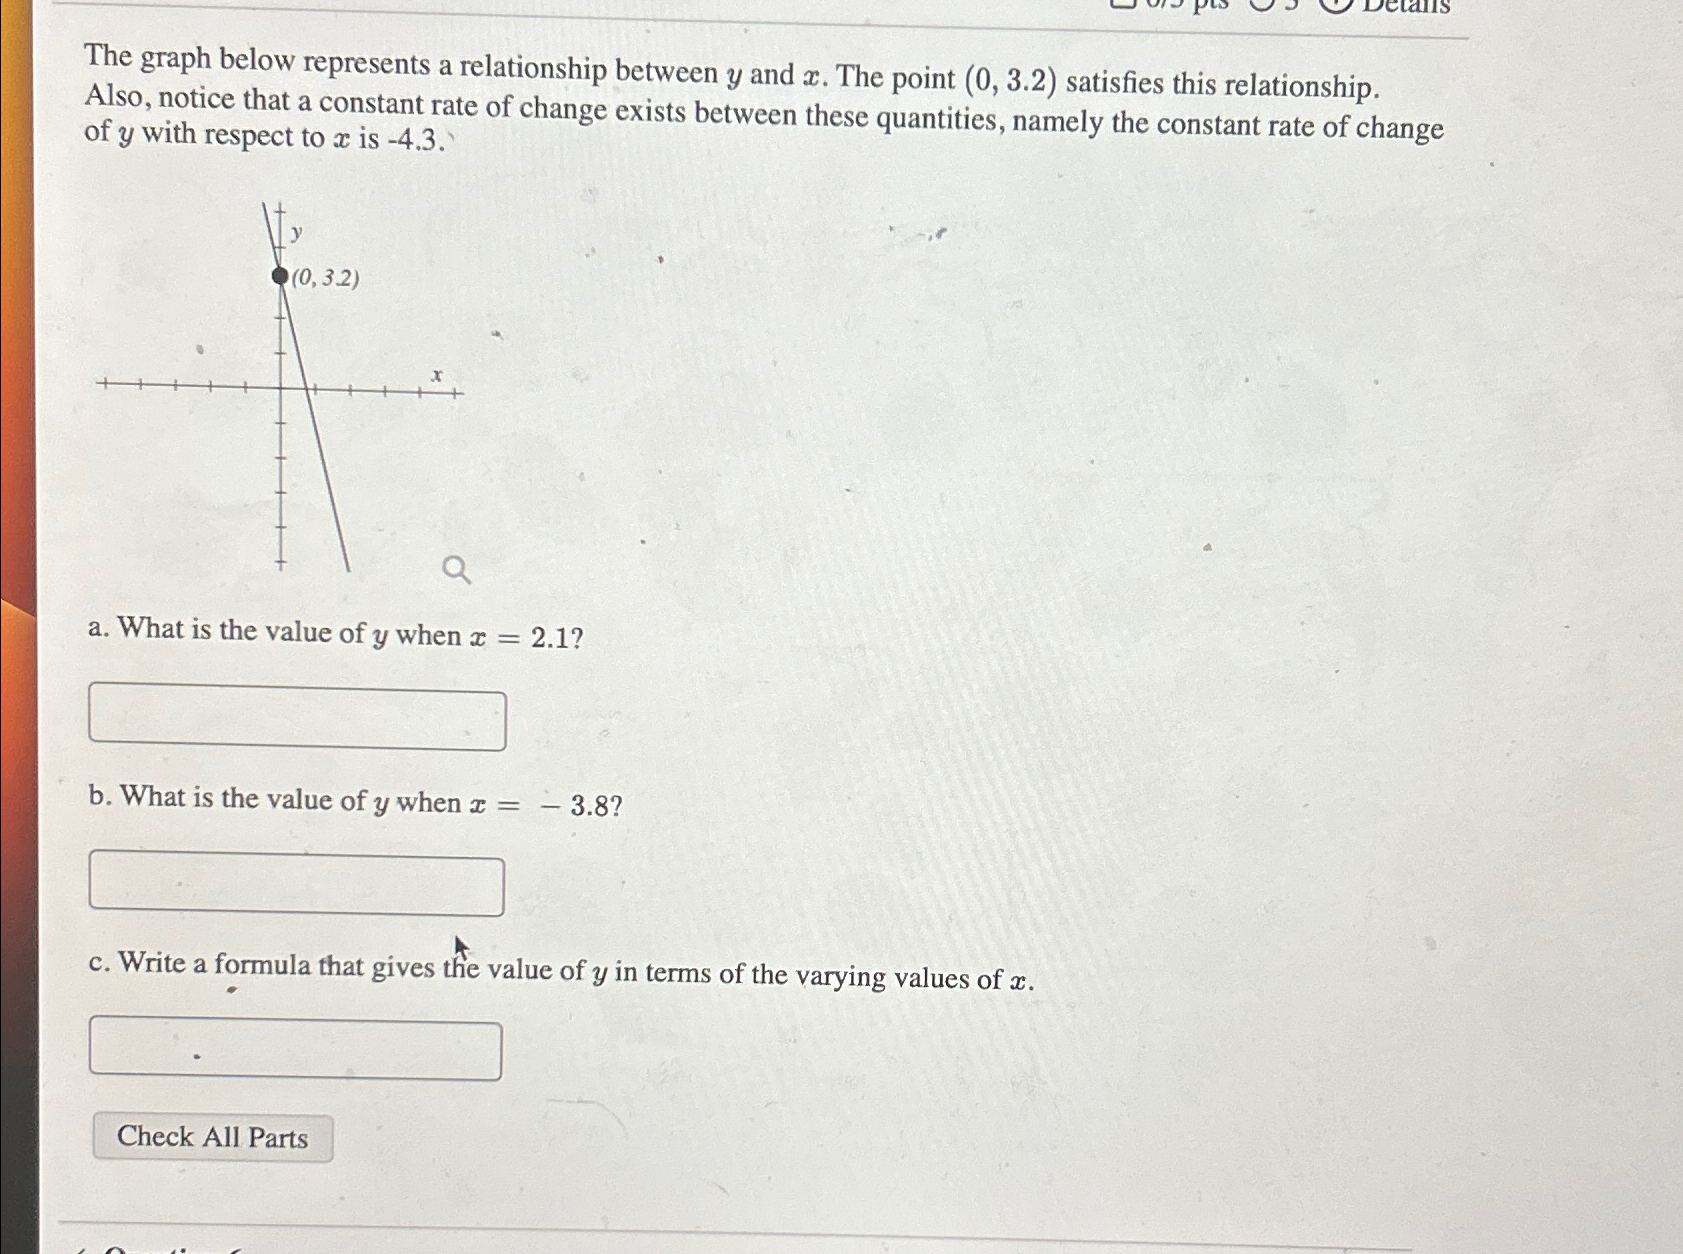
The graph below represents a relationship between y and x. The point (0,3.2) satisfies this relationship. Also, notice that a constant rate of change exists between these quantities, namely the constant rate of change of y with respect to x is -4.3 . a. What is the value of y when x=2.1 ? b. What is the value of y when x=3.8 ? c. Write a formula that gives the value of y in terms of the varying values of x
Step by Step Solution
There are 3 Steps involved in it

Get step-by-step solutions from verified subject matter experts