

Question: The graph below represents continuous probability distribution functions for three (3) different populations: A, B, and C. 0.9 0.8 0.7 0.6 0.4 0.3 E 0.2
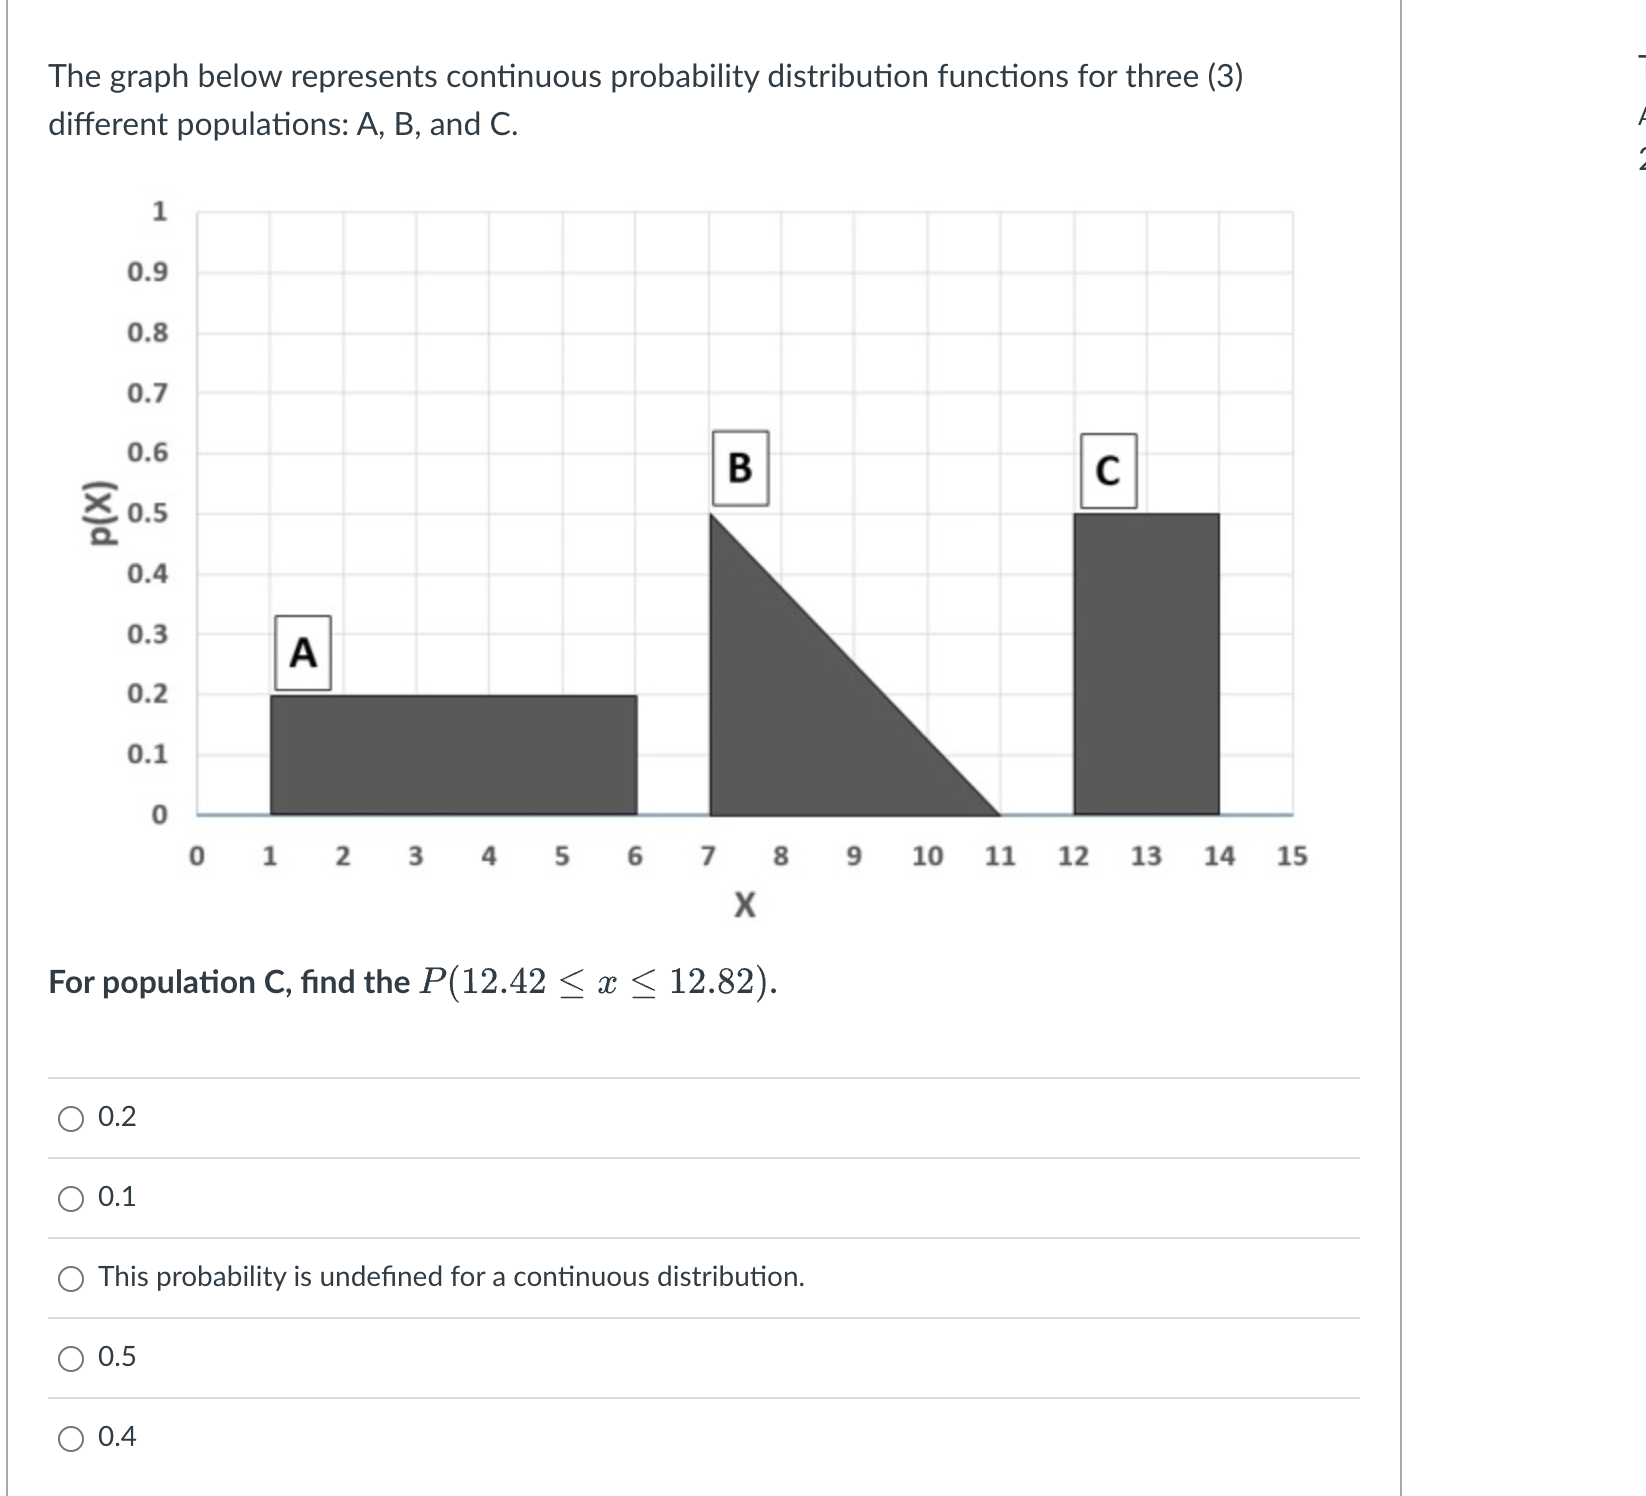
The graph below represents continuous probability distribution functions for three (3) different populations: A, B, and C. 0.9 0.8 0.7 0.6 0.4 0.3 E 0.2 0.1 For population C, find the P(12.42
Step by Step Solution
There are 3 Steps involved in it
1 Expert Approved Answer
Step: 1 Unlock

Question Has Been Solved by an Expert!
Get step-by-step solutions from verified subject matter experts
Step: 2 Unlock
Step: 3 Unlock