

Question: The graph below represents data that was collected by students on the number of social media posts they made the previous day SOCIAL MEDIA POSTS

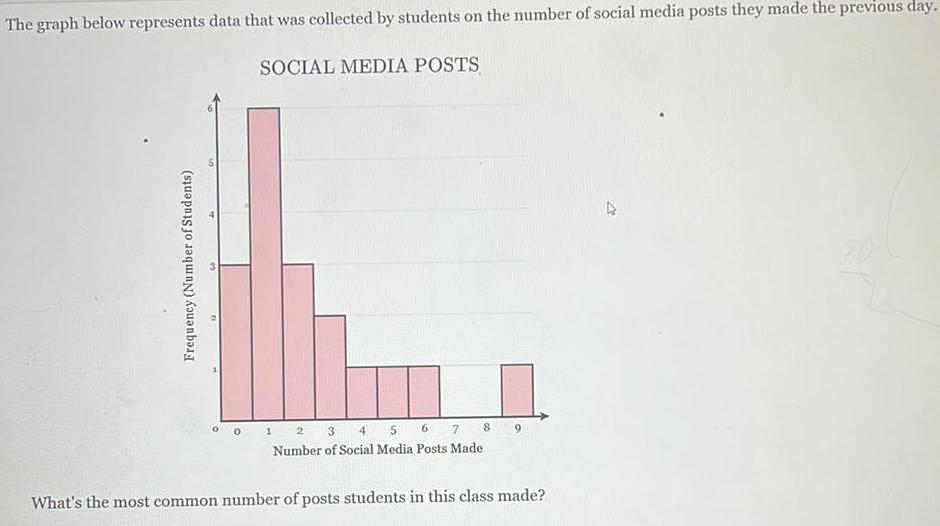
The graph below represents data that was collected by students on the number of social media posts they made the previous day SOCIAL MEDIA POSTS Frequency Number of Students 1 2 3 4 5 6 7 Number of Social Media Posts Made 8 9 What s the most common number of posts students in this class made
Step by Step Solution
There are 3 Steps involved in it
1 Expert Approved Answer
Step: 1 Unlock

Question Has Been Solved by an Expert!
Get step-by-step solutions from verified subject matter experts
Step: 2 Unlock
Step: 3 Unlock