

Question: The graph below represents the known data points of 3% and 1% defect rates and extends the trend line to a projected 10% defect rate.
The graph below represents the known data points of 3% and 1% defect rates and extends the trend line to a projected 10% defect rate.
Question: If the defect rate were to increase beyond its present rate, what would likely be an additional, perhaps unanticipated consequence?
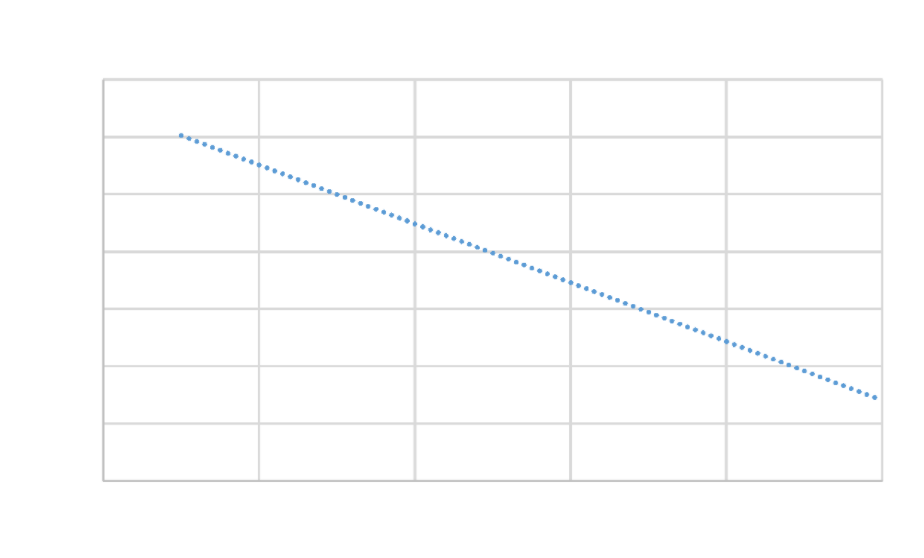
The image above depicts a graph with a negatively sloping line.
| Sales would likely diminish as they would acquire a reputation for not producing quality products | ||
| Costs of reworked product or warranty claims would decrease | ||
| Sales would likely increase as the owner would have to more aggressively market products in order to compensate for the defect rate | ||
| Profits would increase as they are not spending money on expensive efforts in improve quality |
Step by Step Solution
There are 3 Steps involved in it

Get step-by-step solutions from verified subject matter experts