

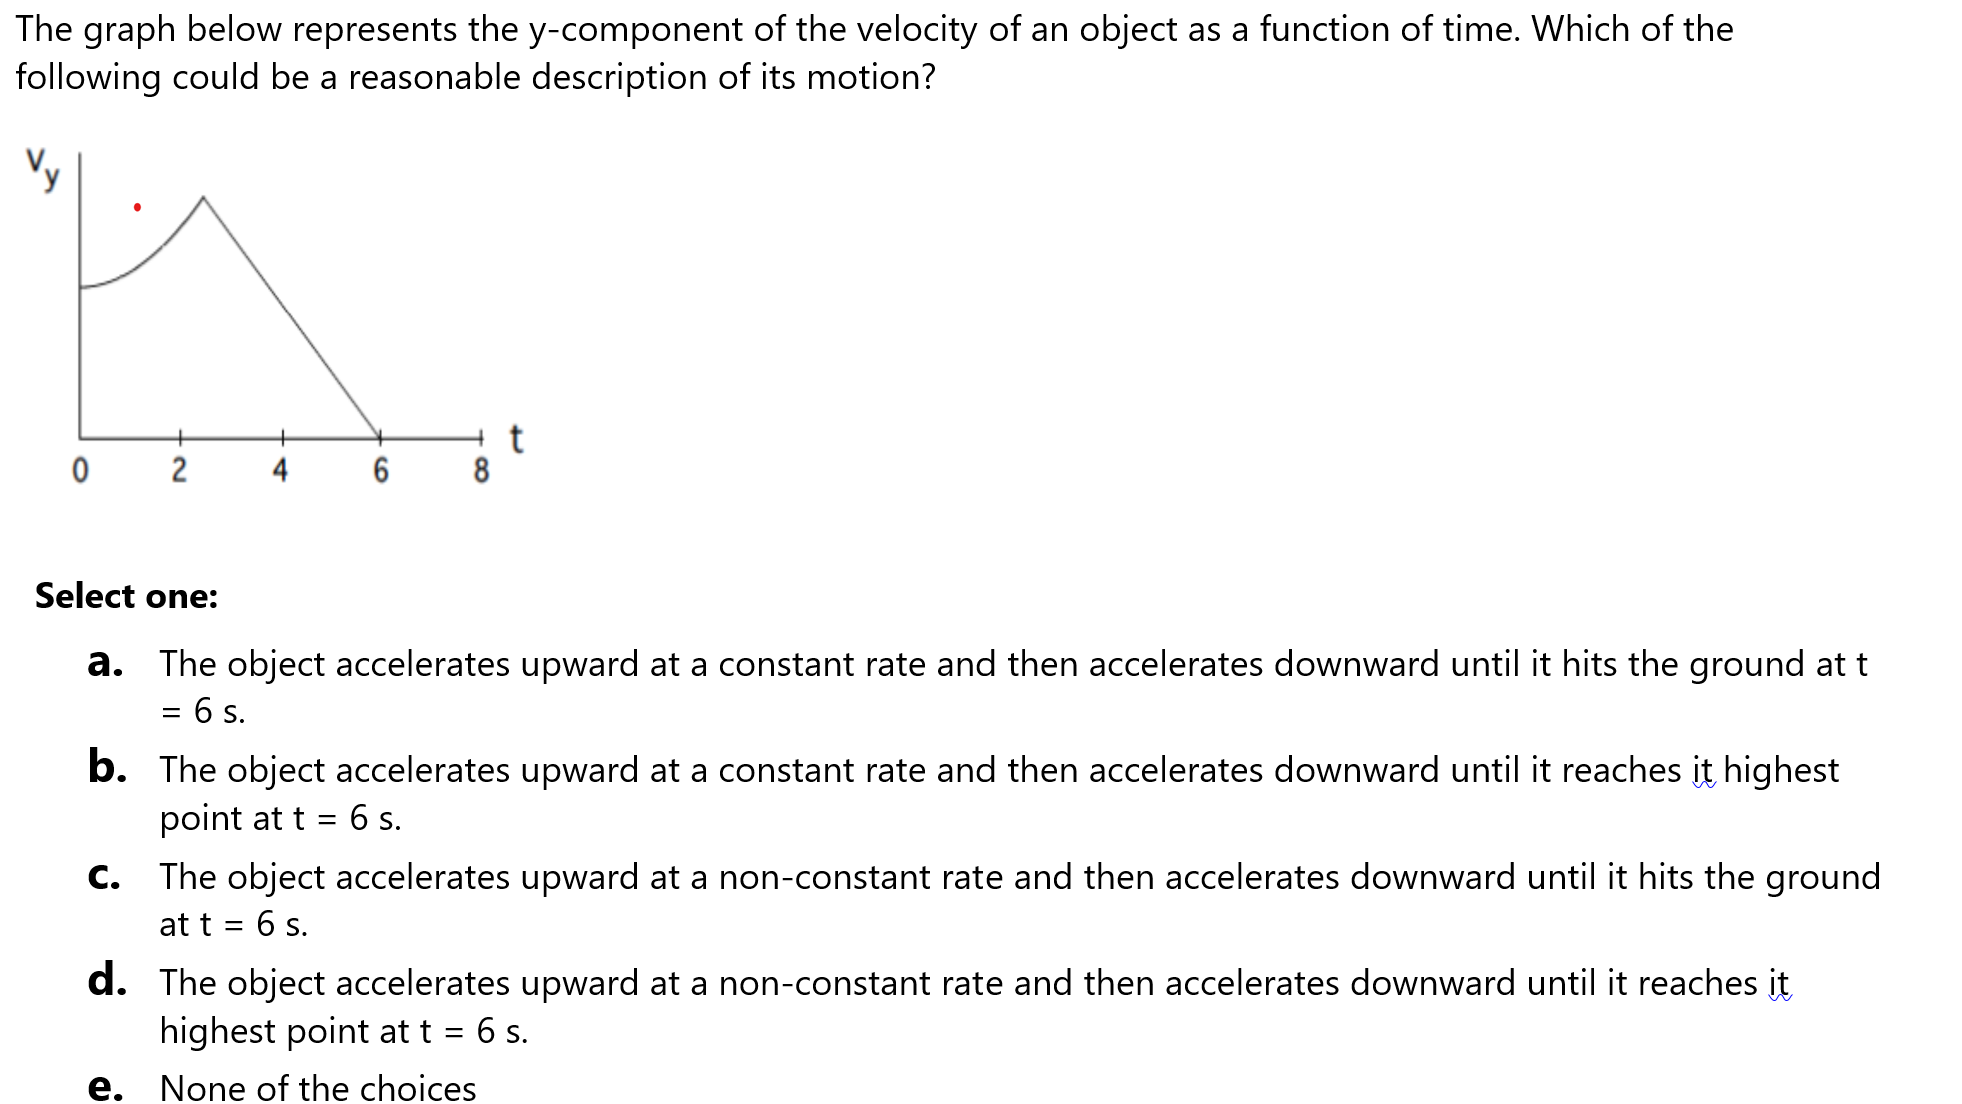
Question: The graph below represents the y - component of the velocity of an object as a function of time. Which of the following could be
The graph below represents the component of the velocity of an object as a function of time. Which of the
following could be a reasonable description of its motion?
Select one:
a The object accelerates upward at a constant rate and then accelerates downward until it hits the ground at
b The object accelerates upward at a constant rate and then accelerates downward until it reaches it highest
point at
C The object accelerates upward at a nonconstant rate and then accelerates downward until it hits the ground
at
d The object accelerates upward at a nonconstant rate and then accelerates downward until it reaches it
highest point at
e None of the choices
Step by Step Solution
There are 3 Steps involved in it
1 Expert Approved Answer
Step: 1 Unlock

Question Has Been Solved by an Expert!
Get step-by-step solutions from verified subject matter experts
Step: 2 Unlock
Step: 3 Unlock