

Question: The graph below shows a cost behavior that might happen in a certain company's cost structure. The vertical axis represents total cost and the horizontal
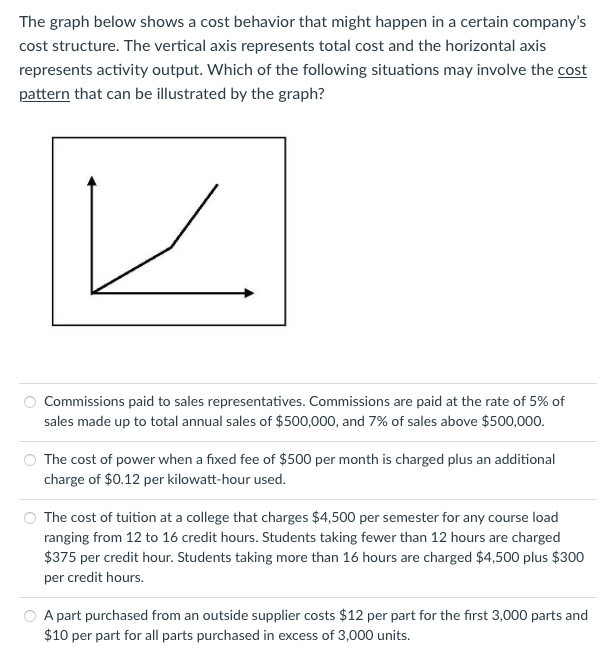
The graph below shows a cost behavior that might happen in a certain company's cost structure. The vertical axis represents total cost and the horizontal axis represents activity output. Which of the following situations may involve the cost pattern that can be illustrated by the graph? Commissions paid to sales representatives. Commissions are paid at the rate of 5% of sales made up to total annual sales of $500,000, and 7% of sales above $500,000. The cost of power when a fixed fee of $500 per month is charged plus an additional charge of $0.12 per kilowatt-hour used. The cost of tuition at a college that charges $4,500 per semester for any course load ranging from 12 to 16 credit hours. Students taking fewer than 12 hours are charged $375 per credit hour. Students taking more than 16 hours are charged $4,500 plus $300 per credit hours. A part purchased from an outside supplier costs $12 per part for the first 3,000 parts and $10 per part for all parts purchased in excess of 3,000 units
Step by Step Solution
There are 3 Steps involved in it

Get step-by-step solutions from verified subject matter experts