

Question: The graphs below represent examples of cost behavior patterns that might occur in a company's cost structure. The vertical axis represents total cost, and the
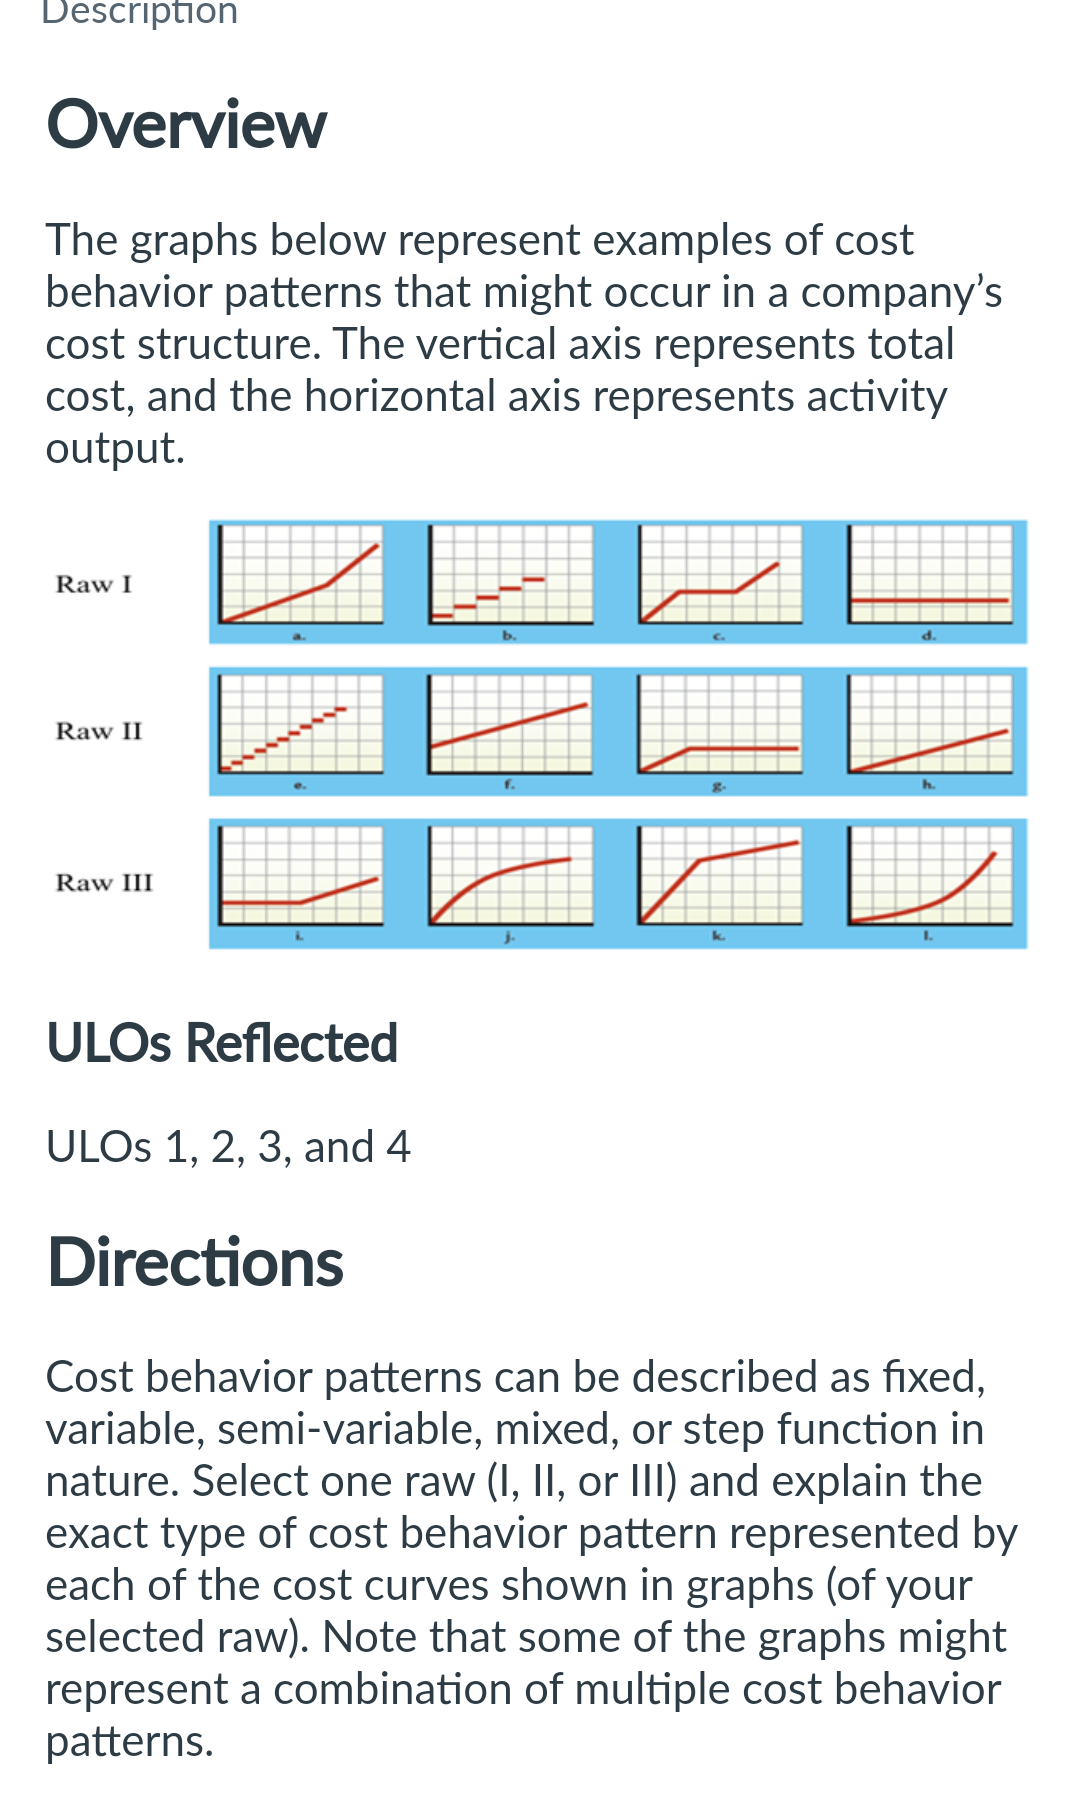
The graphs below represent examples of cost behavior patterns that might occur in a company's cost structure. The vertical axis represents total cost, and the horizontal axis represents activity output. ULOs Reflected ULOs 1,2,3, and 4 Directions Cost behavior patterns can be described as fixed, variable, semi-variable, mixed, or step function in nature. Select one raw (I, II, or III) and explain the exact type of cost behavior pattern represented by each of the cost curves shown in graphs (of your selected raw). Note that some of the graphs might represent a combination of multiple cost behavior patterns
Step by Step Solution
There are 3 Steps involved in it
1 Expert Approved Answer
Step: 1 Unlock

Question Has Been Solved by an Expert!
Get step-by-step solutions from verified subject matter experts
Step: 2 Unlock
Step: 3 Unlock