

Question: The graph below shows a distribution that is called a chi-squared distribution. For this distribution, the median is: 10. The graph below shows a distribution
The graph below shows a distribution that is called a chi-squared distribution. For this distribution, the median is:
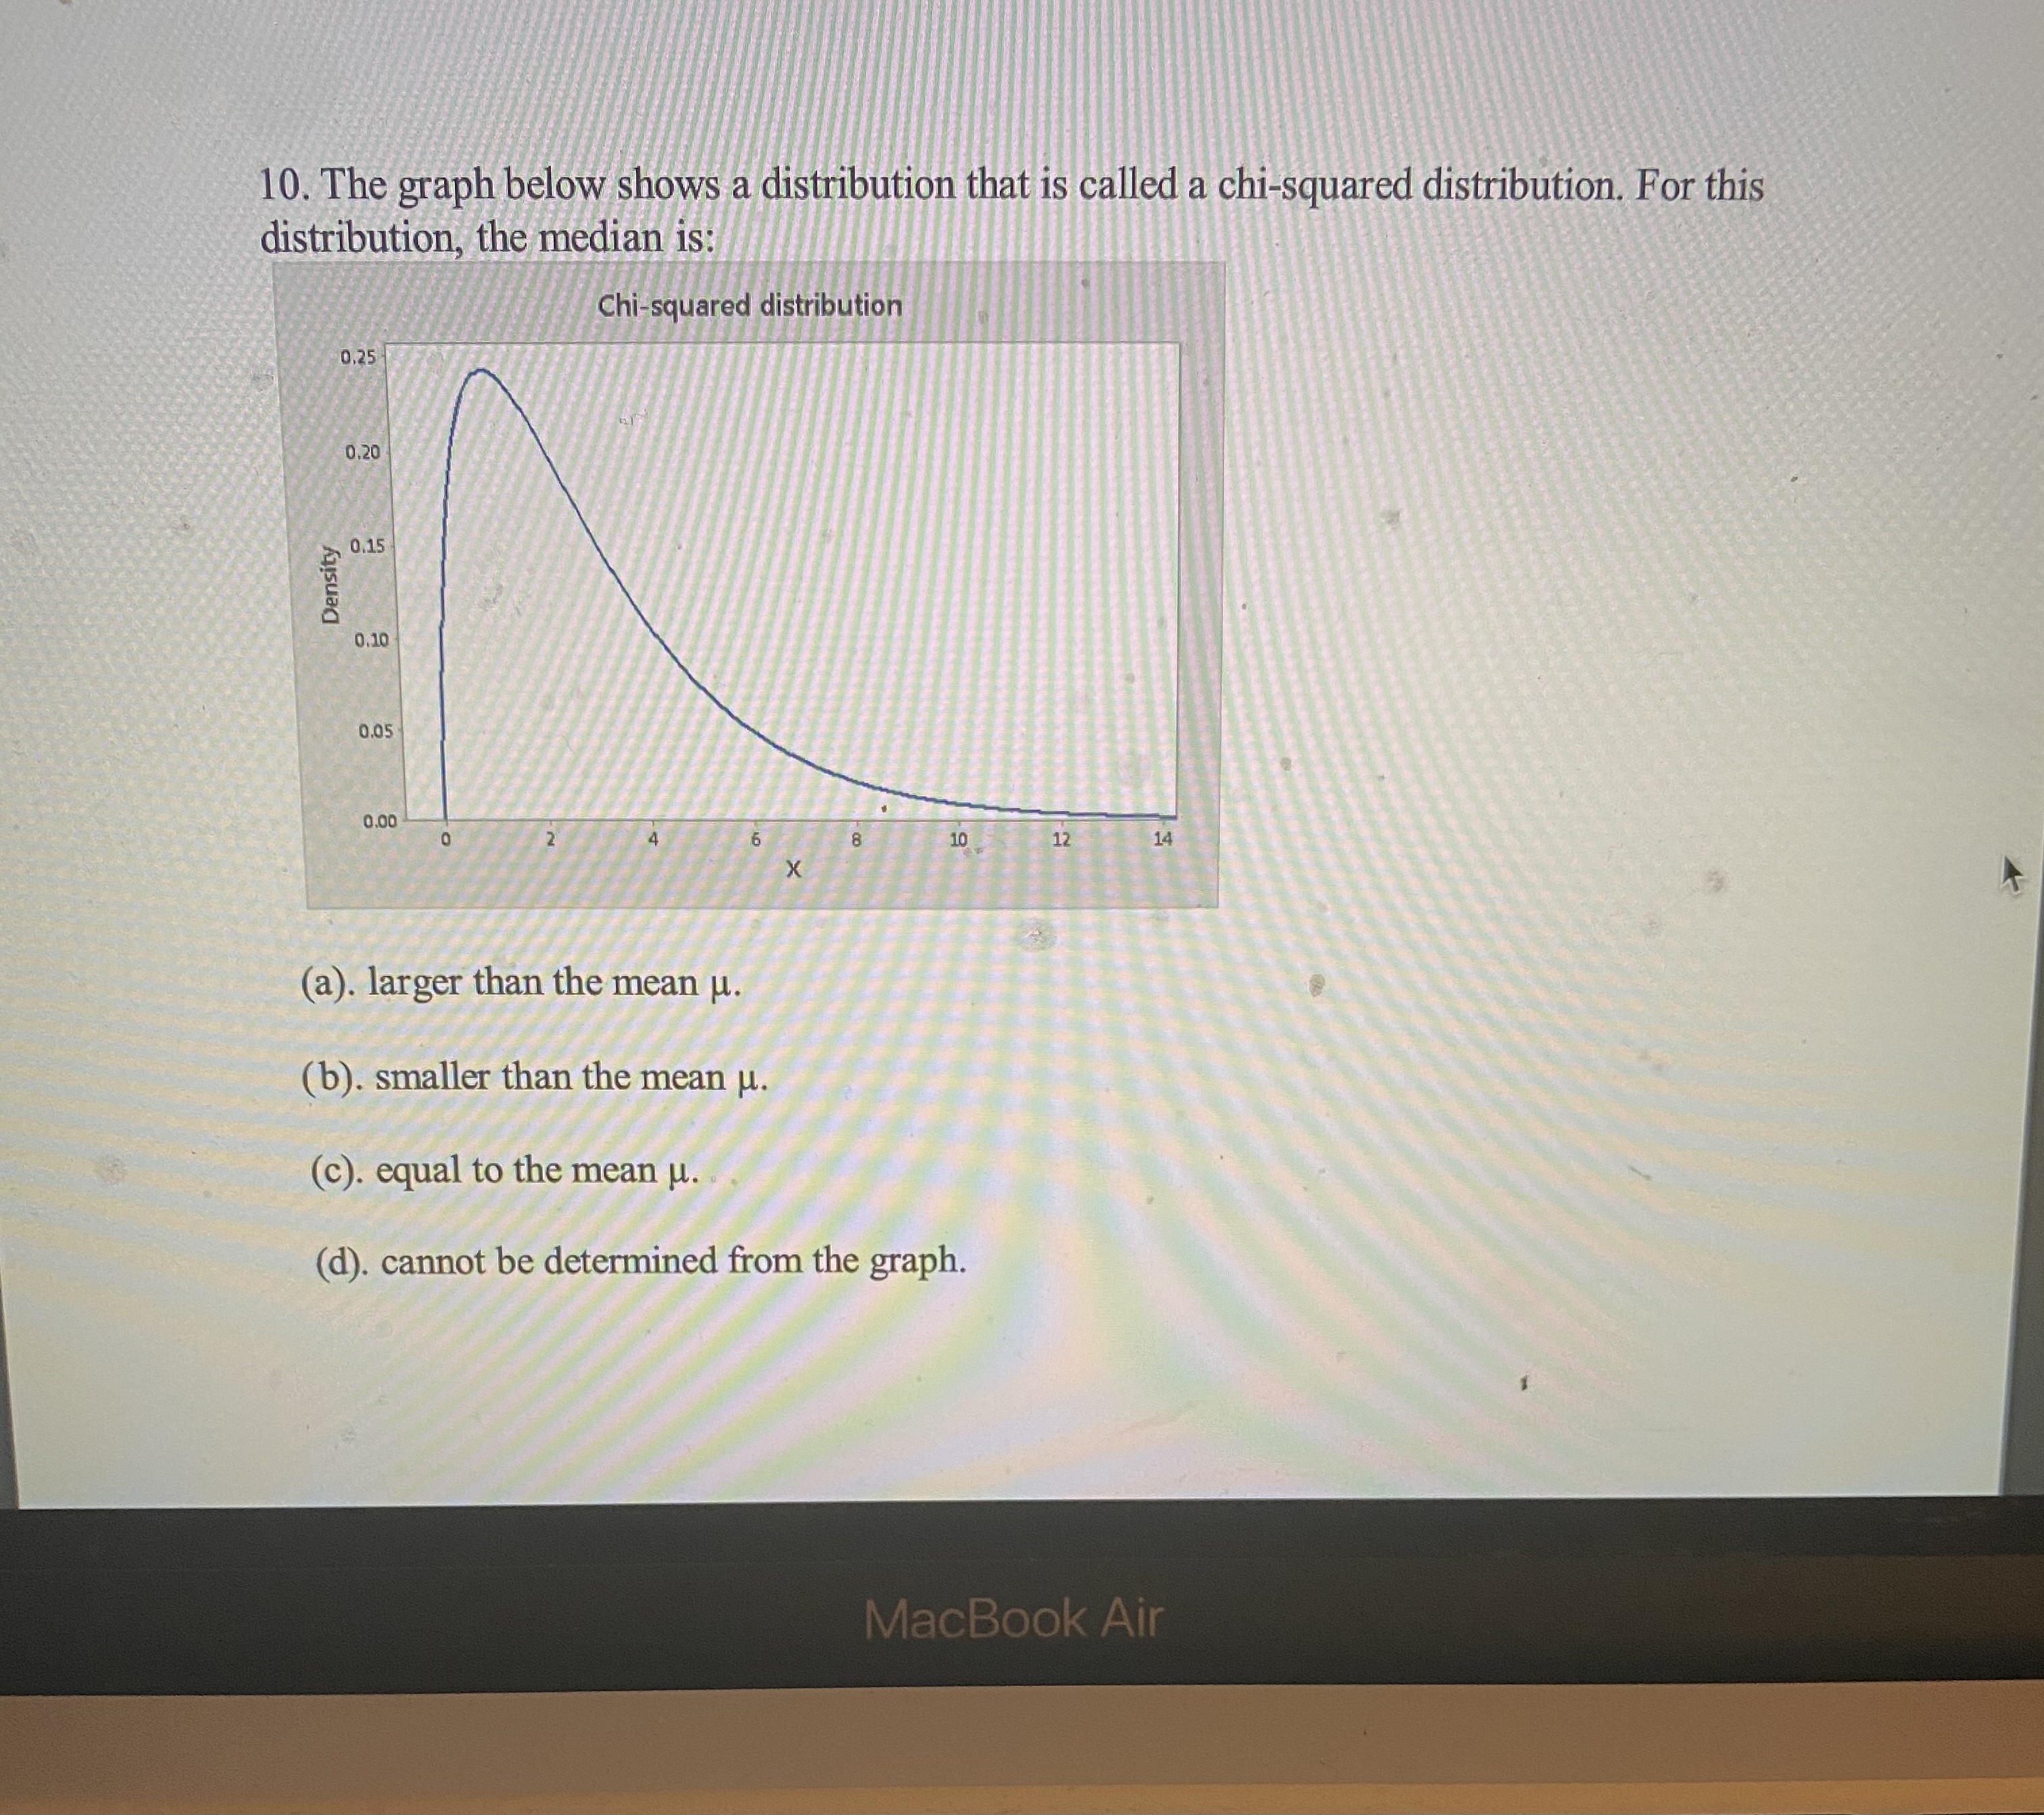
10. The graph below shows a distribution that is called a chi-squared distribution. For this distribution, the median is: Chi-squared distribution 0,25 020 0 15 Density 0.10 0.05 0.00 10 12 14 X (a). larger than the mean u. (b). smaller than the mean u. (c). equal to the mean u. (d). cannot be determined from the graph. MacBook Air
Step by Step Solution
There are 3 Steps involved in it
1 Expert Approved Answer
Step: 1 Unlock

Question Has Been Solved by an Expert!
Get step-by-step solutions from verified subject matter experts
Step: 2 Unlock
Step: 3 Unlock