

The graph below shows the concentration of cyclobutane as it decomposes over time at 1270K. (i) Based
Fantastic news! We've Found the answer you've been seeking!
Question:
The graph below shows the concentration of cyclobutane as it decomposes over time at 1270K.
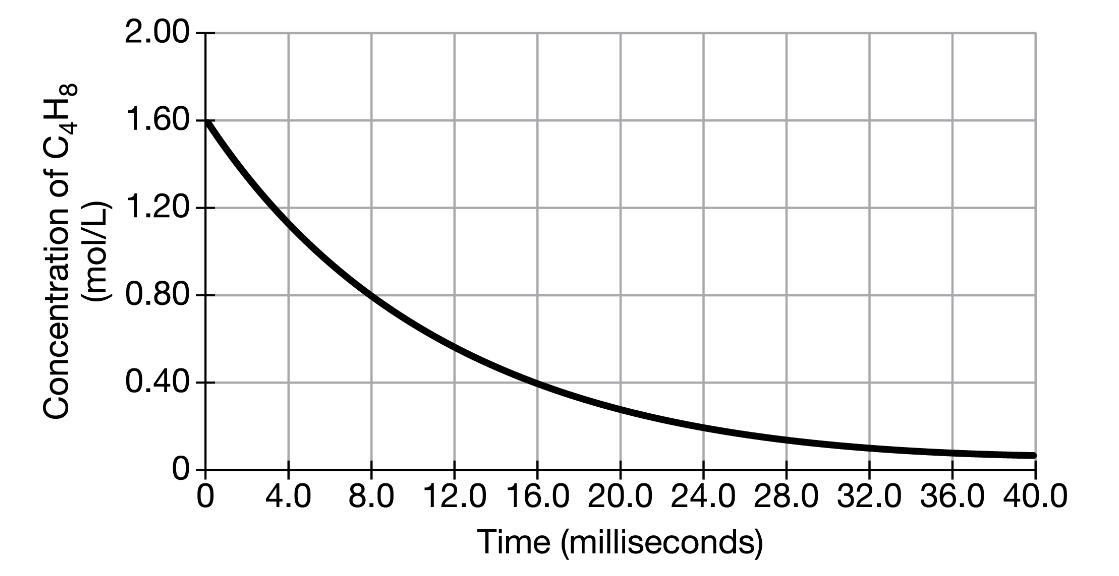
(i) Based on the graph, determine the order of the decomposition reaction of cyclobutane at 1270K. Justify your answer.
(ii) Calculate the time, in milliseconds, that it would take 99 percent of the original cyclobutane at 1270K to decompose.
Expert Answer:

Related Book For 

Financial Algebra advanced algebra with financial applications
ISBN: 978-0538449670
1st edition
Authors: Robert K. Gerver
Posted Date:
