

Question: The graph below shows the demand for Cosmic shampoo. E 80 60 40 COStS and revenues 20 200 400 600 300 1000 Quantity per period
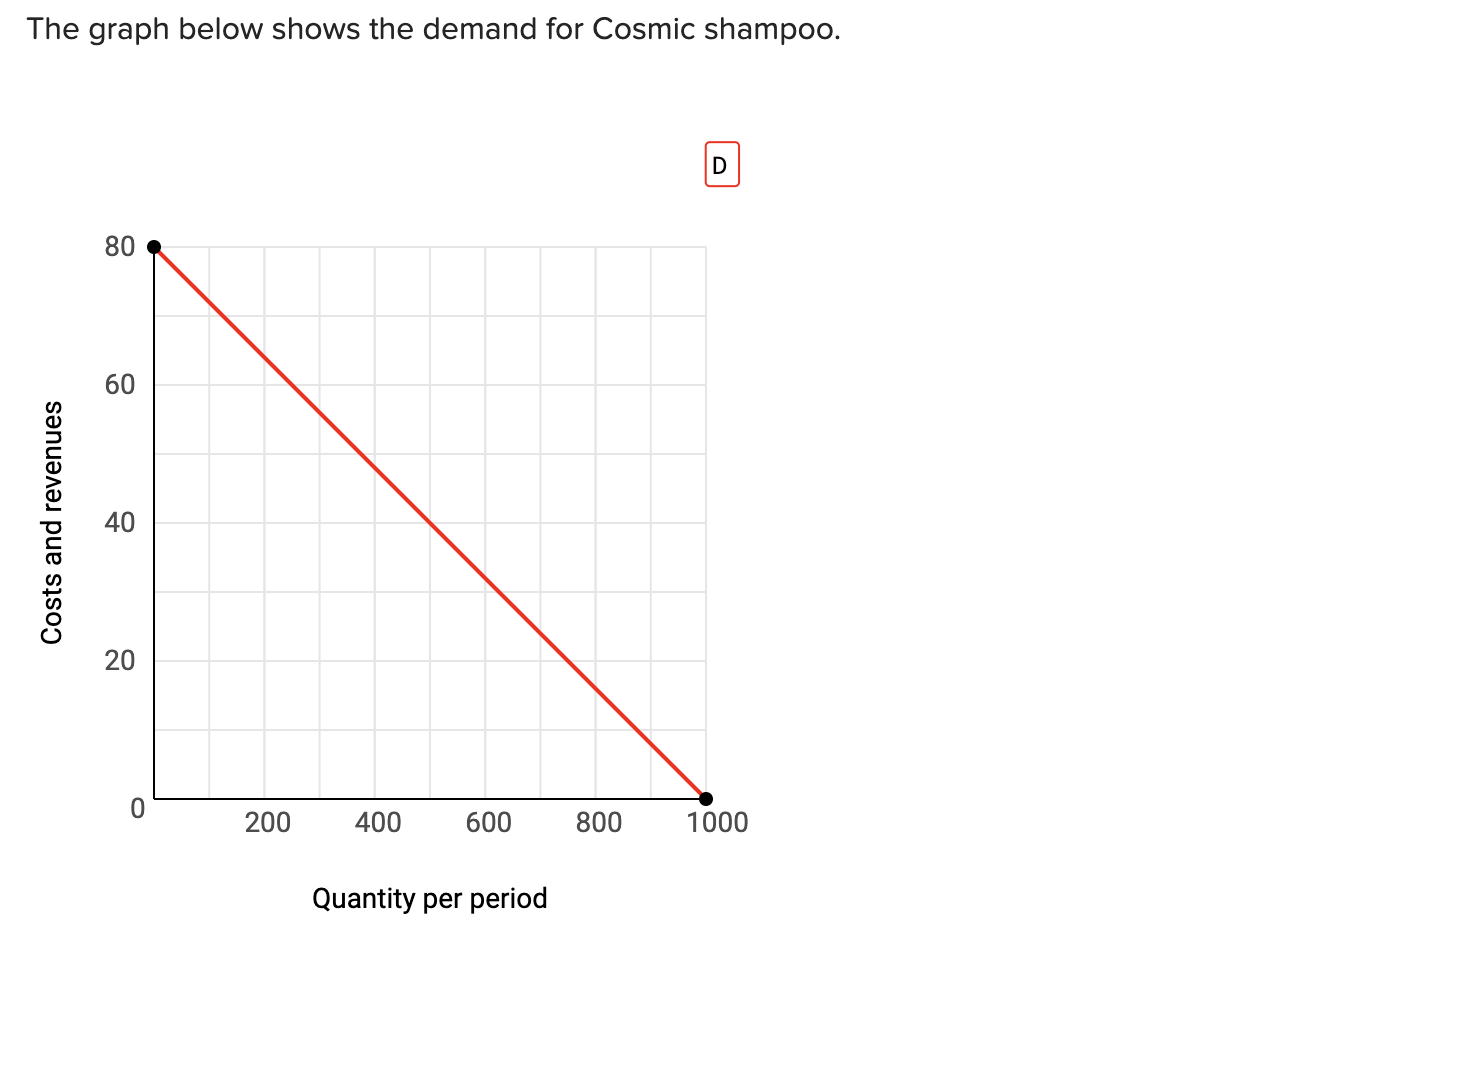

The graph below shows the demand for Cosmic shampoo. E 80 60 40 COStS and revenues 20 200 400 600 300 1000 Quantity per period
Step by Step Solution
There are 3 Steps involved in it
1 Expert Approved Answer
Step: 1 Unlock

Question Has Been Solved by an Expert!
Get step-by-step solutions from verified subject matter experts
Step: 2 Unlock
Step: 3 Unlock