

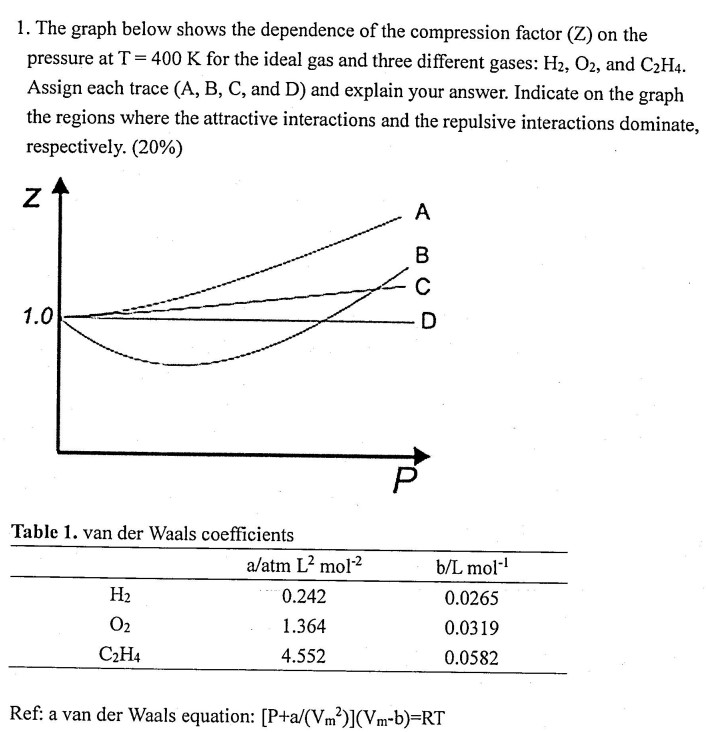
Question: The graph below shows the dependence of the compression factor ( Z ) on the pressure at T = 4 0 0 K for the
The graph below shows the dependence of the compression factor on the
pressure at for the ideal gas and three different gases: and
Assign each trace A B C and D and explain your answer. Indicate on the graph
the regions where the attractive interactions and the repulsive interactions dominate,
respectively.
Table van der Waals coefficients
Ref: a van der Waals equation:
Step by Step Solution
There are 3 Steps involved in it
1 Expert Approved Answer
Step: 1 Unlock

Question Has Been Solved by an Expert!
Get step-by-step solutions from verified subject matter experts
Step: 2 Unlock
Step: 3 Unlock