

Question: The graph below shows the market for soya beans: Plot the two end points using the tool provided in the graphing area below. Plot only
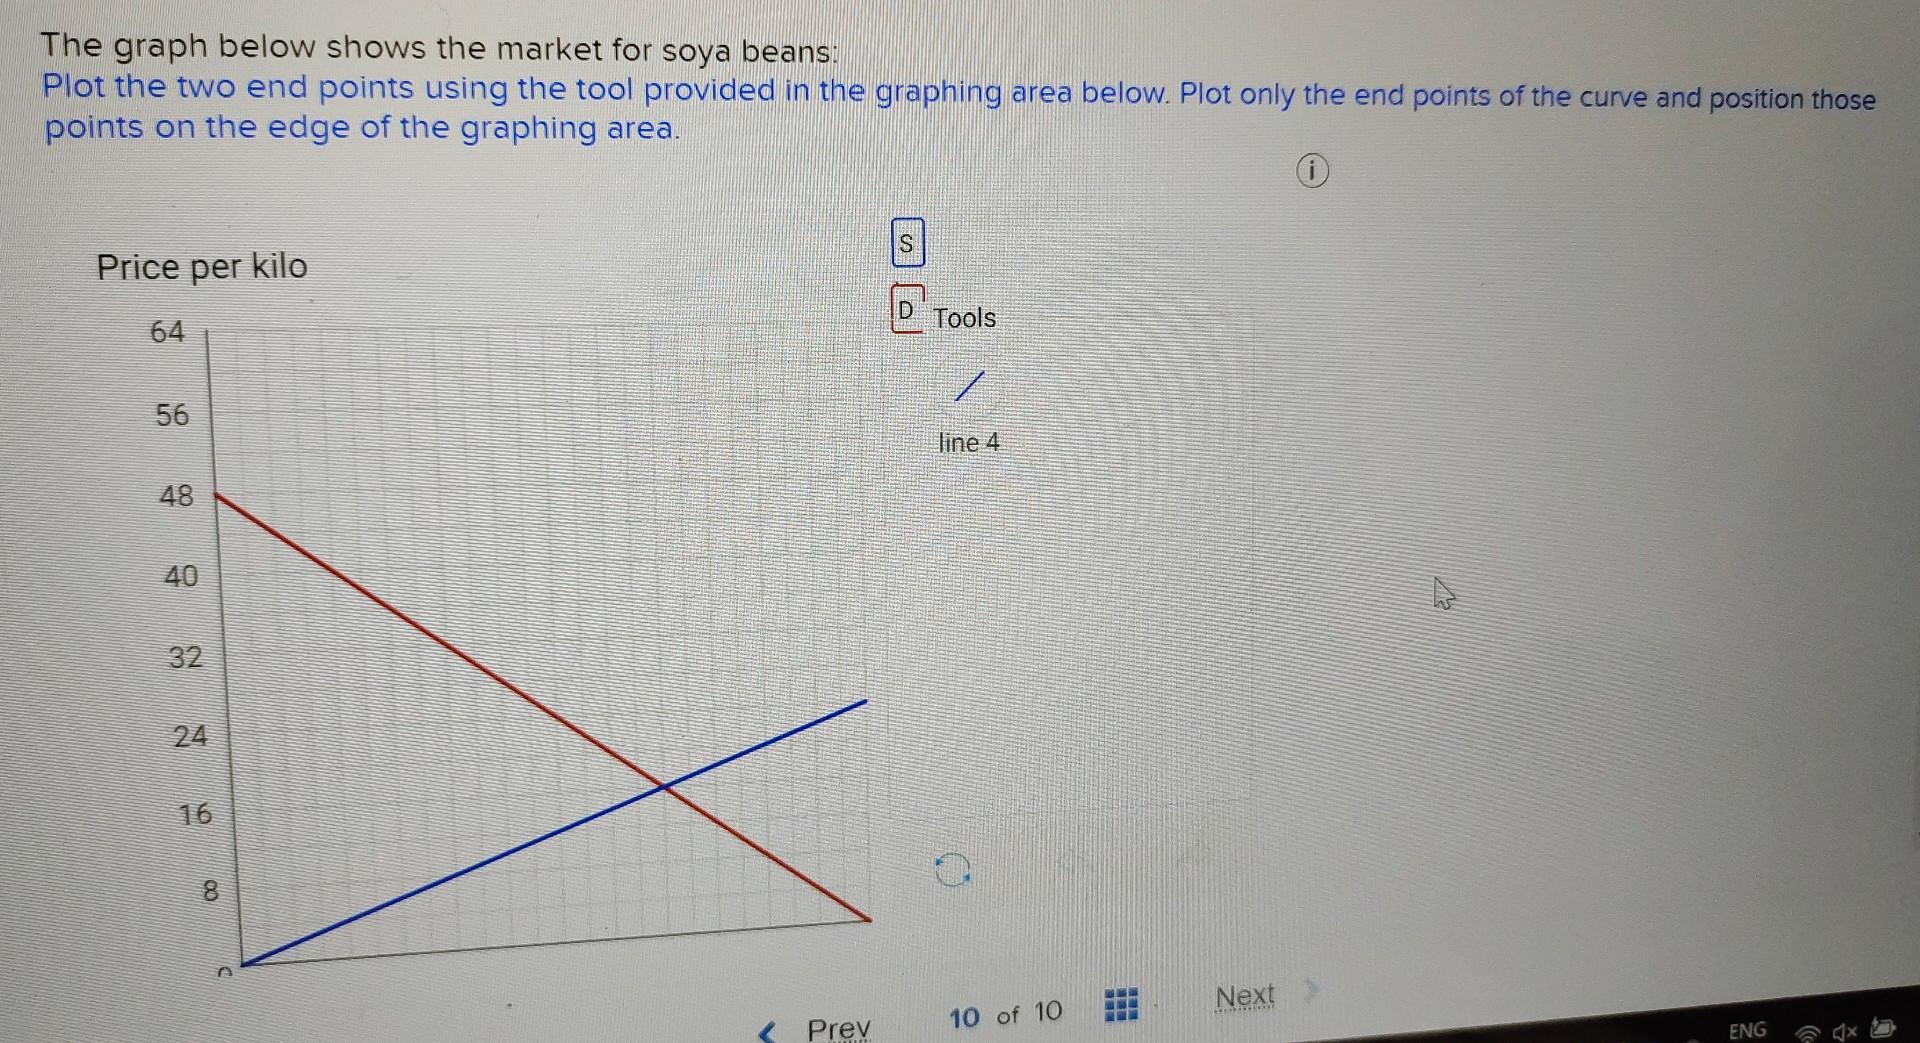
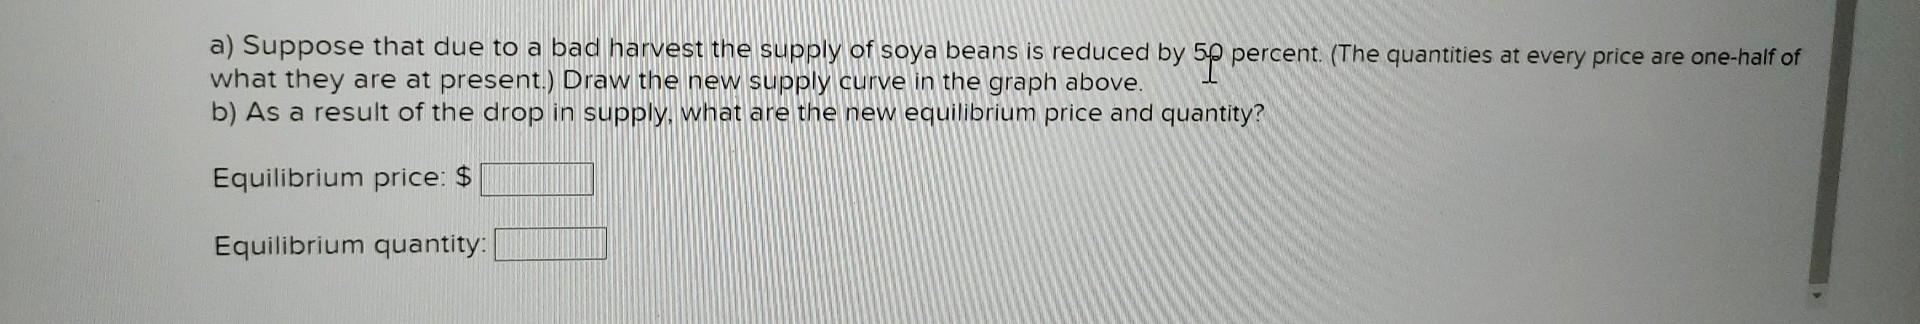
The graph below shows the market for soya beans: Plot the two end points using the tool provided in the graphing area below. Plot only the end points of the curve and position those points on the edge of the graphing area. (i) a) Suppose that due to a bad harvest the supply of soya beans is reduced by 5p percent. (The quantities at every price are one-half of what they are at present.) Draw the new supply curve in the graph above. b) As a result of the drop in supply, what are the new equilibrium price and quantity? Equilibrium price: $ Equilibrium quantity
Step by Step Solution
There are 3 Steps involved in it
To solve the problem lets go through the steps Step 1 Identify the Current Equilibrium From the grap... View full answer

Get step-by-step solutions from verified subject matter experts