

Question: The graph below shows the market for soya beans: Plot the two end points using the tool provided in the graphing area below. Plot only
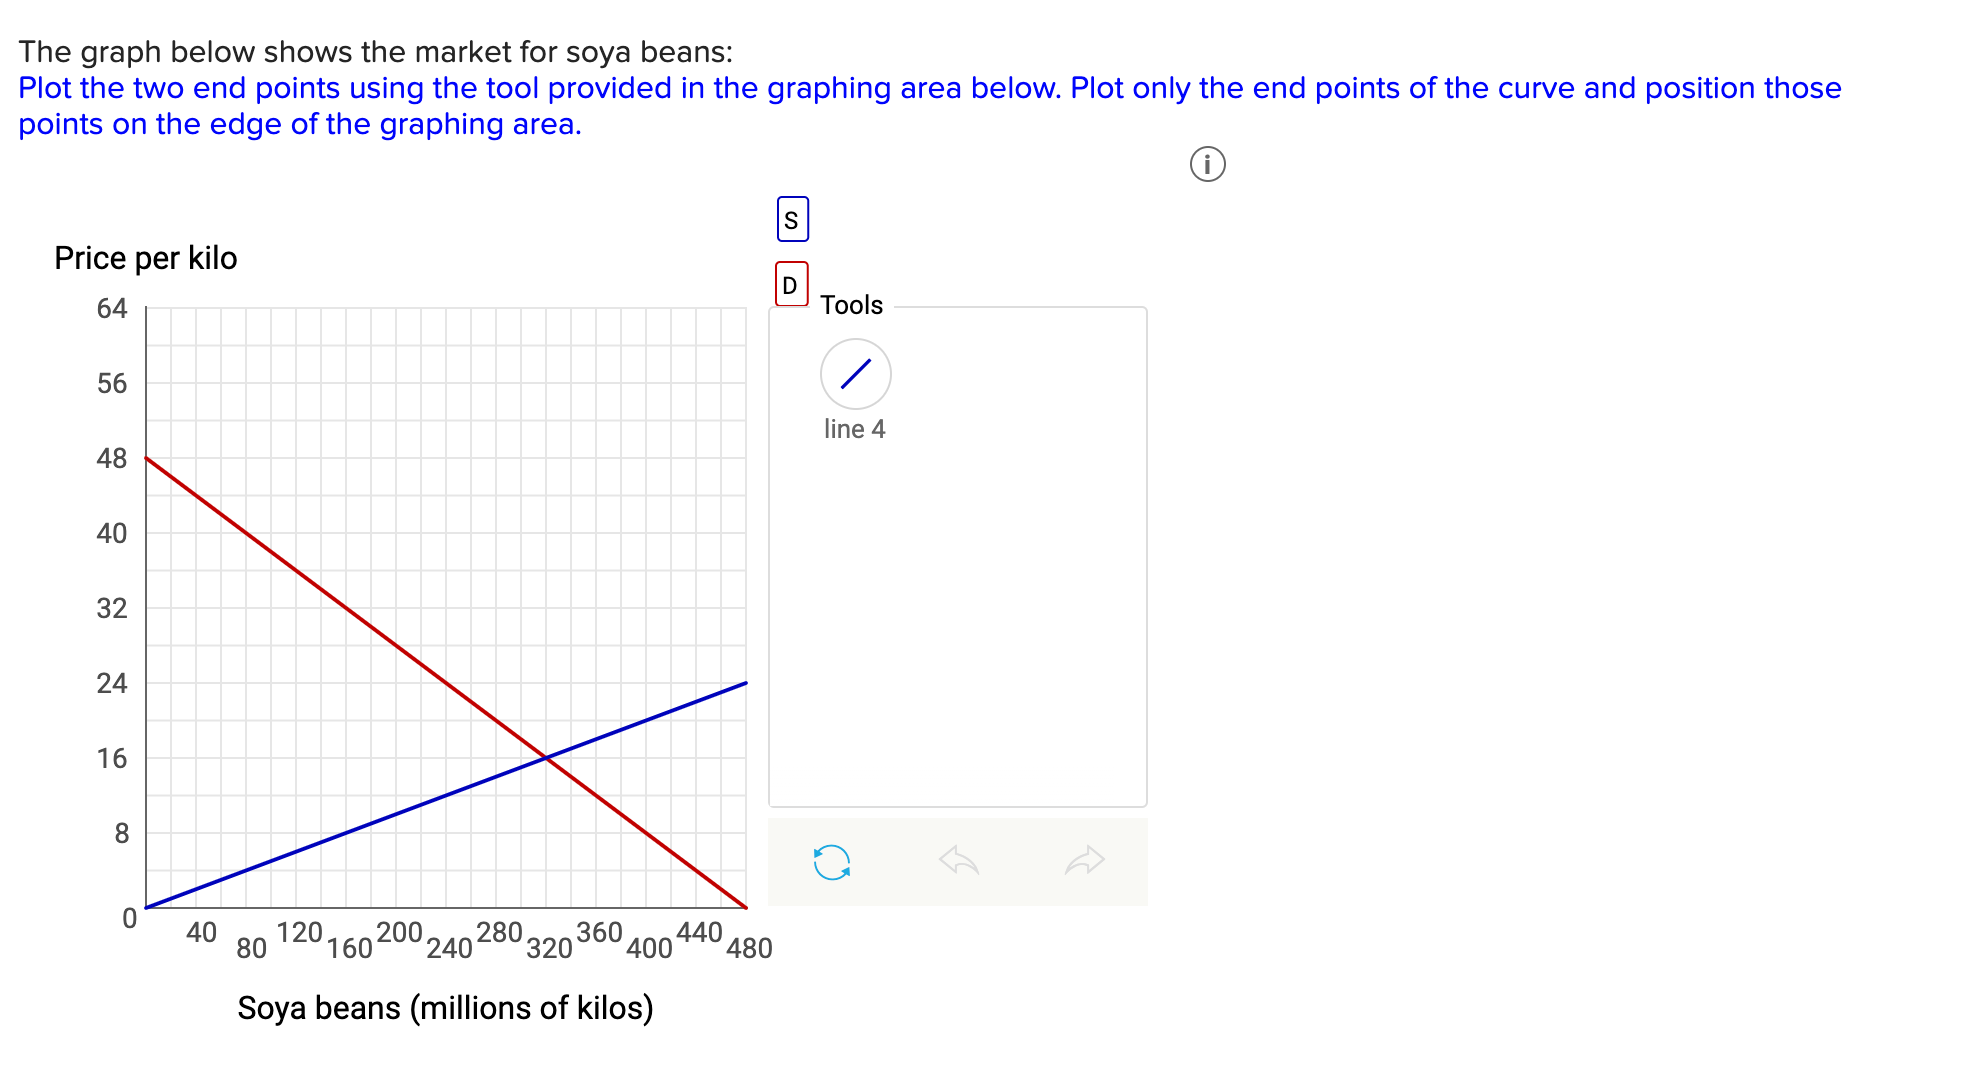
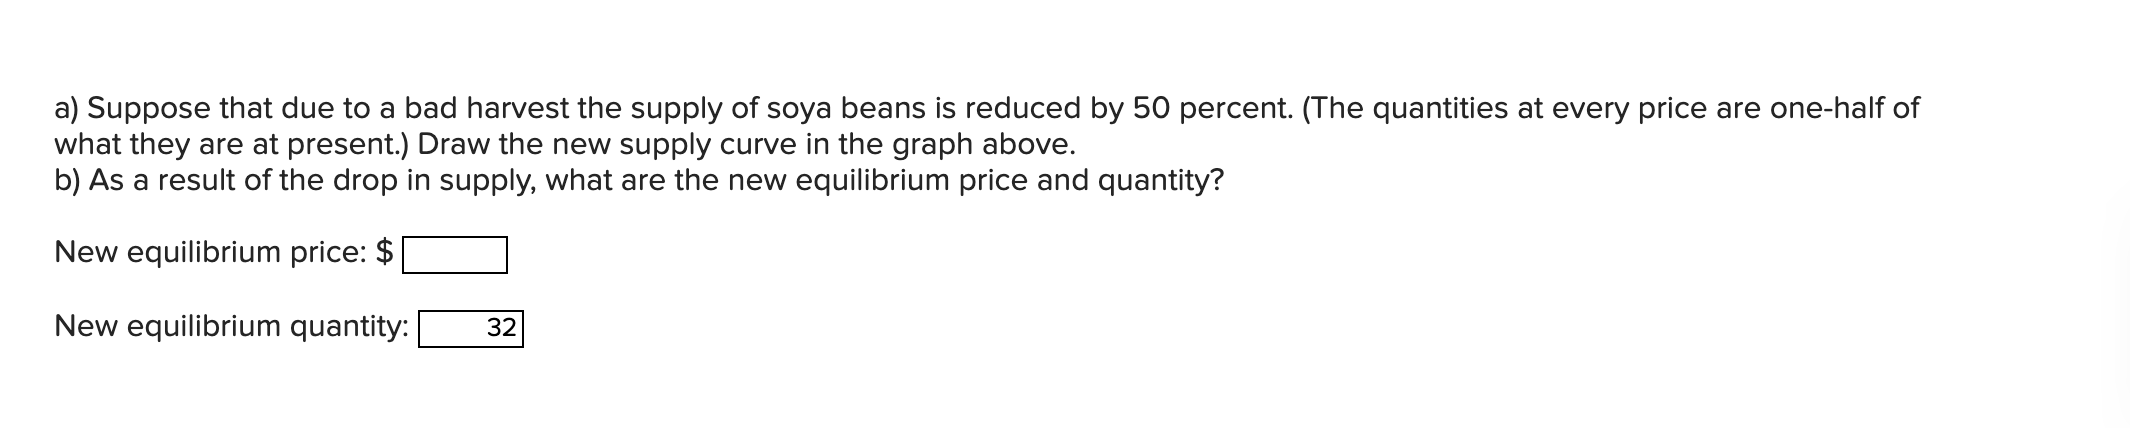
The graph below shows the market for soya beans: Plot the two end points using the tool provided in the graphing area below. Plot only the end points of the curve and position those points on the edge of the graphing area. S Price per kilo D 64 Tools 56 line 4 48 40 32 24 16 8 0 40 80 120 160 200 240 280 320 360 400 440 480 Soya beans (millions of kilos)a) Suppose that due to a bad harvest the supply of soya beans is reduced by 50 percent. (The quantities at every price are one-half of what they are at present.) Draw the new supply curve in the graph above. b) As a result of the drop in supply, what are the new equilibrium price and quantity? New equilibrium price: $ New equilibrium quantity: 32
Step by Step Solution
There are 3 Steps involved in it

Get step-by-step solutions from verified subject matter experts