

Question: The graph below shows the market for widgets. $40 Demand $30 Supply- Price $20 $10 0 2 4 6 8 10 12 14 16 18

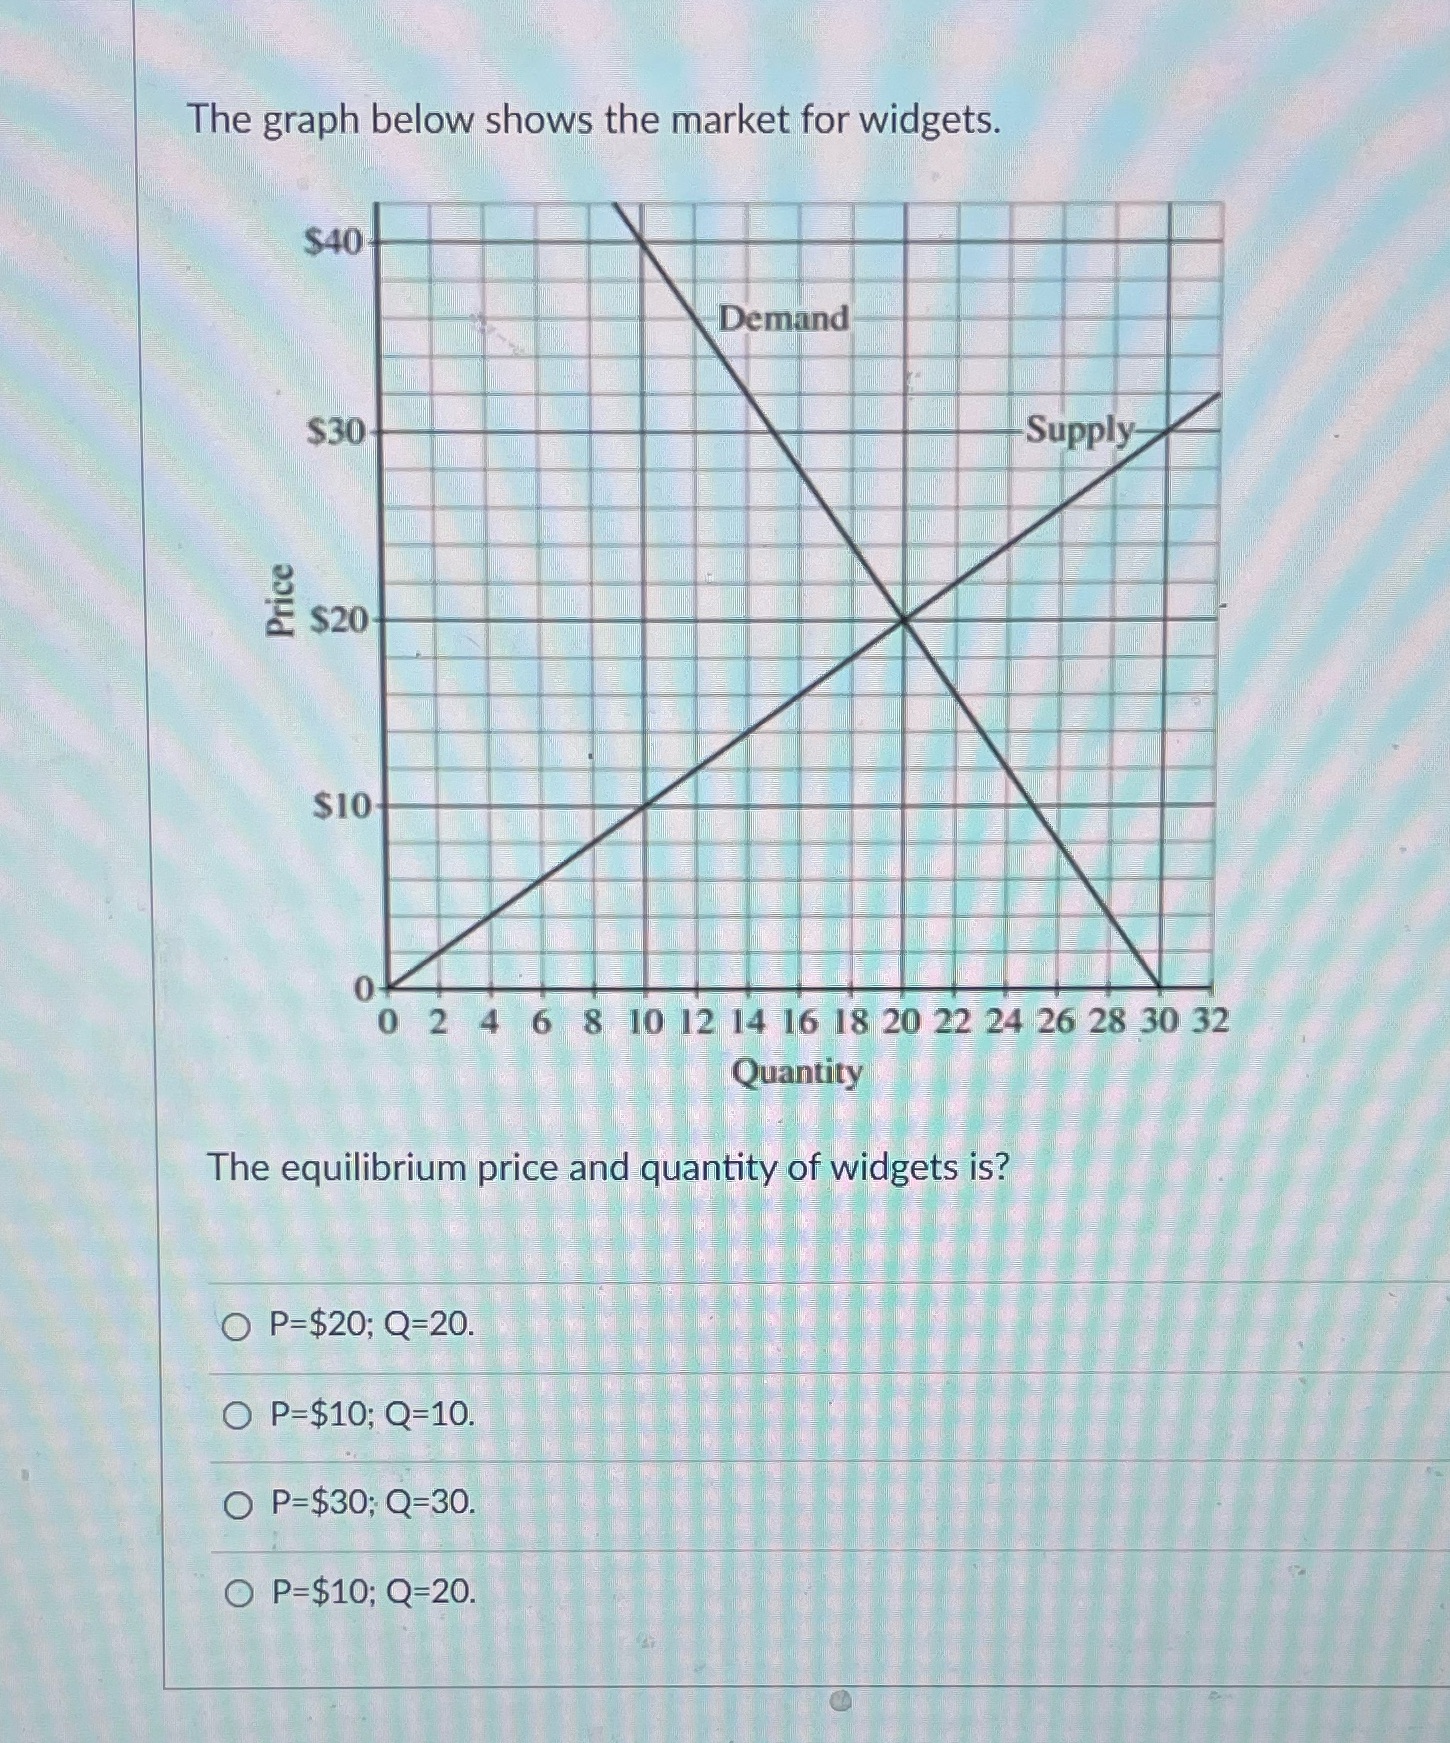
The graph below shows the market for widgets. $40 Demand $30 Supply- Price $20 $10 0 2 4 6 8 10 12 14 16 18 20 22 24 26 28 30 32 Quantity The equilibrium price and quantity of widgets is? O P=$20; Q=20. O P=$10; Q=10. O P=$30; Q=30. O P=$10; Q=20
Step by Step Solution
There are 3 Steps involved in it
1 Expert Approved Answer
Step: 1 Unlock

Question Has Been Solved by an Expert!
Get step-by-step solutions from verified subject matter experts
Step: 2 Unlock
Step: 3 Unlock