

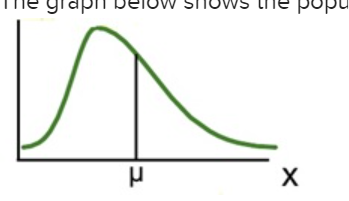
Question: The graph below shows the population distribution of variable X with expected value . ff
The graph below shows the population distribution of variableXwith expected value.
\f\f
Step by Step Solution
There are 3 Steps involved in it
1 Expert Approved Answer
Step: 1 Unlock

Question Has Been Solved by an Expert!
Get step-by-step solutions from verified subject matter experts
Step: 2 Unlock
Step: 3 Unlock