

Question: The graph below shows the position function of a vehicle: s(t) A B G C E, D H a) Is the vehicle going faster
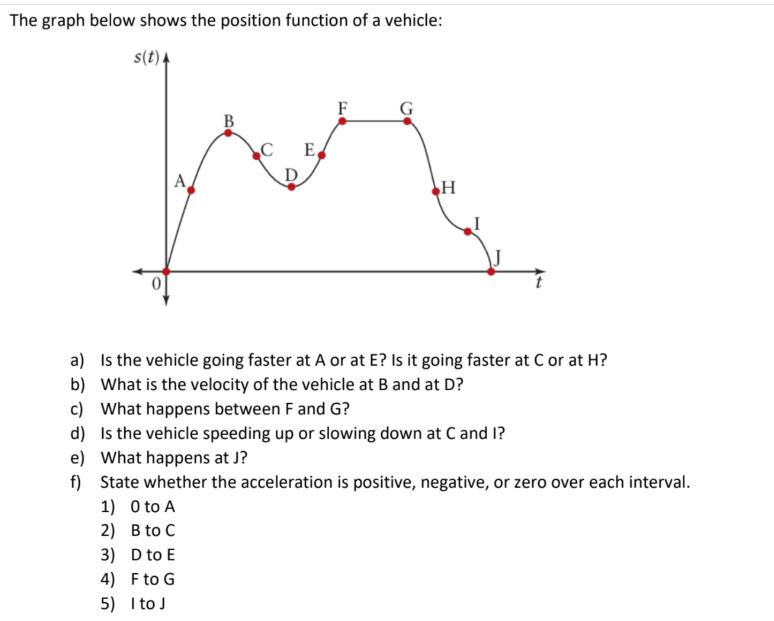
The graph below shows the position function of a vehicle: s(t) A B G C E, D H a) Is the vehicle going faster at A or at E? Is it going faster at C or at H? b) What is the velocity of the vehicle at B and at D? c) What happens between F and G? d) Is the vehicle speeding up or slowing down at C and I? e) What happens at J? f) State whether the acceleration is positive, negative, or zero over each interval. 1) O to A 2) B to C 3) D to E 4) F to G 5) Ito J
Step by Step Solution
There are 3 Steps involved in it
1 Expert Approved Answer
Step: 1 Unlock

Question Has Been Solved by an Expert!
Get step-by-step solutions from verified subject matter experts
Step: 2 Unlock
Step: 3 Unlock